
System monitoring for a new generation with Prometheus
Level DB and DIY
Prometheus handles data management with a combination of Level DB and a SoundCloud invention. The data model relies on Level DB for indexing, but SoundCloud designed its own approach to storing data structures. In the SoundCloud developer blog, the developers explained that, in their opinion, there was no such thing as a storage engine capable of storing time series entries.
The Prometheus server is not just the storage back end that picks up data from exporters in the cluster. It is, at the same time, the port of call for users or other applications that want to read the data. To allow this to happen, the developers have devised their own query language: PromQL (Prometheus Query Language) works similarly to SQL for other databases, although it does have its own syntax (Figure 3).
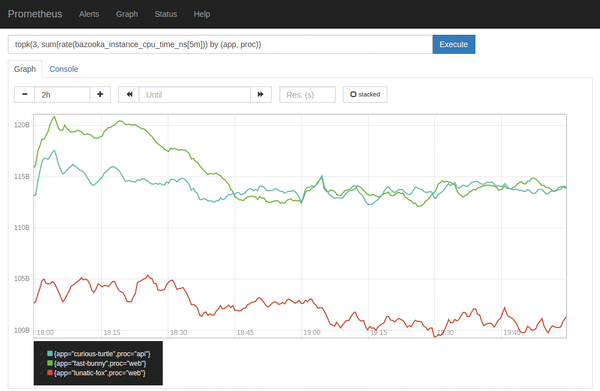 Figure 3: PromQL is a query language for Prometheus, trimmed to the needs of a time series database.
Each Prometheus instance offers a rudimentary web interface from which to submit queries. But, this local interface is not suitable for virtualization data. SoundCloud's own dashboard is used for virtualization data. However, if you just want some initial information, Prometheus' own interface will probably do the job.
Exporters
The neatest monitoring solution is nothing if it is unable to make statements about the state of individual services in the cluster, and this data has to come from somewhere. Prometheus refers to the process of collecting data as scraping. Prometheus also has its own kind of service for scraping: the exporters.
Exporters do not simply check process states on the basis of the process ID, which is what simple Nagios plugins do; instead they take a more sophisticated approach. Within Prometheus, the exporters create a data structure for the service and then read the service's metrics. In practical terms, Prometheus would retrieve the details of how many instances of haproxy were running over a certain period of time and alert if the value of this metric were too low.
Exporters are a curse and a blessing at the same time for administrators. On the one hand, developing an exporter for a specific server is far more complex than developing a minimal Nagios plugin. The exporter for HA Proxy offered by Prometheus itself makes this quite clear: In addition to familiarity with Go, you also need in-depth knowledge of which metrics are actually usable for the target service. On the other hand, you need to be familiar with Prometheus' data structure because you cannot meaningfully create metrics without this knowledge.
On a more positive note, monitoring is far more precise than what simple Nagios plugins provide. A good example is the HA Proxy Exporter: in addition to a plain statement on the matter of traffic passing through the load balancer, the current version in Prometheus gives you detailed statements on availability and performance for individual pages of the front ends configured in HA Proxy. In other words, the effort put into developing exporters does pay dividends.
The good news is that pre-built exporters already exist for many classical services. You can either pick them up from Prometheus or check with the community, where other administrators are writing and publishing exporters. The Prometheus website for exporters [6] has an up-to-date list and links to exporters for MySQL, Bind, or Apache, just to name a few.
A few services, such as Etcd, or various services from Google's Kubernetes, even offer native support for Prometheus. When Prometheus learns about the services, it automatically picks up the matching metrics.
Service Discovery
Prometheus now offers two different approaches to automatic service discovery. You can either employ DNS SRV records or use the cluster registry included with the Consul service management tool [7].
The idea behind this approach is simple: if you need to pick up the same metrics from 200 hosts, it doesn't make sense to force the admin to manually maintain a database of the existing machines when each new cluster node will need to be configured in exactly the same way for Prometheus. Using auto-discovery, Prometheus handles this task for the admin and saves a lot of work by doing so.
The node exporter has a special role – again, the exporter is offered directly by Prometheus. It provides information on each system, for example, the history of the CPU or RAM load.
« Previous 1 2 3 4 Next »
Buy this article as PDF
(incl. VAT)
Buy Linux Magazine
US / Canada
UK / Australia
Subscribe to our Linux Newsletters
Find Linux and Open Source Jobs
Subscribe to our ADMIN Newsletters
Support Our Work
Linux Magazine content is made possible with support from readers like you. Please consider contributing when you’ve found an article to be beneficial.

News
-
XZ Gets the All-Clear
The back door xz vulnerability has been officially reverted for Fedora 40 and versions 38 and 39 were never affected.
-
Canonical Collaborates with Qualcomm on New Venture
This new joint effort is geared toward bringing Ubuntu and Ubuntu Core to Qualcomm-powered devices.
-
Kodi 21.0 Open-Source Entertainment Hub Released
After a year of development, the award-winning Kodi cross-platform, media center software is now available with many new additions and improvements.
-
Linux Usage Increases in Two Key Areas
If market share is your thing, you'll be happy to know that Linux is on the rise in two areas that, if they keep climbing, could have serious meaning for Linux's future.
-
Vulnerability Discovered in xz Libraries
An urgent alert for Fedora 40 has been posted and users should pay attention.
-
Canonical Bumps LTS Support to 12 years
If you're worried that your Ubuntu LTS release won't be supported long enough to last, Canonical has a surprise for you in the form of 12 years of security coverage.
-
Fedora 40 Beta Released Soon
With the official release of Fedora 40 coming in April, it's almost time to download the beta and see what's new.
-
New Pentesting Distribution to Compete with Kali Linux
SnoopGod is now available for your testing needs
-
Juno Computers Launches Another Linux Laptop
If you're looking for a powerhouse laptop that runs Ubuntu, the Juno Computers Neptune 17 v6 should be on your radar.
-
ZorinOS 17.1 Released, Includes Improved Windows App Support
If you need or desire to run Windows applications on Linux, there's one distribution intent on making that easier for you and its new release further improves that feature.