
Audit Your Linux Box
Watching the Filesystem
Consider the following scenario. You have a directory, say, /var/cache/something that keeps a cache expensive to rebuild. Yet something cleans up files in it on a regular basis. What is it? A cron script? An over-diligent user? Or maybe a malware? Stop guessing – the audit subsystem can tell you for sure (Figure 3).
 Figure 3: The Linux Audit homepage is an example of old-school web design, but it also contains many useful specs.
You start with adding a watch for the pathname you want to monitor:
# auditctl -w /var/cache/something -p w -k "cache offender"
The -w option tells the filesystem location to watch. The -p option describes access permissions of interest to us: reads (r), writes (w), or attributes changes (a). They are not standard permissions bits you operate with chmod, but rather syscalls issued at the filesystem object, or flags it is open()ed with. File removal is considered to be a directory write, so you track writes here. You also add a key to find generated events later.
Now, wait for the directory to become empty again. When this happens, delete the rule to save system resources, then run:
# ausearch -k "cache offender" -i
As an alternative, you can filter by the directory's pathname:
# ausearch -f /var/cache/something -i
The output could be lengthy, but it will show you a command, a user and process ID, and everything else you need to reach the offender and explain that he is doing something wrong.
Tracing System Calls
Watching the directory as above is the most straightforward solution, but not the only one. Another way is to trace unlink(2) and unlinkat(2) system calls. These syscalls are used to delete a file, and once you have relevant event records, comm and pid will tell you who is doing this.
Adding a syscall rule is not much different from installing a filesystem watch. Remember however that all userspace processes on your box issue system calls and do this quite often. So, if you enable system call tracing, you get a performance hit. In our case, the kernel will have to iterate over rules in the exit list even for processes which never issue unlink(2). The fewer rules you have, the smaller the penalty is. Match multiple system calls in one rule whenever possible, as in the snippet below:
# auditctl -a exit,always -F arch=b64 -S unlink,unlinkat -F path=/var/cache/something -k "cache offender, part two"
Two things to note here. First, I had to specify the system's architecture. Linux distinguishes system calls by their numbers, and these numbers may overlap on different architectures, including 32- and 64-bit x86. Here, I simply force a 64-bit system call table. Second, I use a pathname filter to ignore events unrelated to the cache directory. unlink(2) and unlinkat(2) also receive the pathname as an argument, but you can't filter by it. The reason is you only get pointers, not string values in the audit log (Listing 2).
Listing 2
Syscall Event Record; a0 is the Pathname
When the cache empties again, make a similar search in the event log:
# ausearch -k "cache offender, part two" -i
Of course, it should yield the same offender as before.
Sometimes, you want to trace syscalls in one specific command. Sure, you can add a rule, run the command, and delete it afterwards. The autrace tool wraps this sequence for you. Conceptually, it's similar to strace, yet it produces audit events instead of console output.
Note that autrace flushes audit rules if you have them installed. That's because the tool adds its own temporary rules, and it doesn't want to mess up your rules. Otherwise, using autrace is straightforward (Listing 3).
Listing 3
Running autrace
The output shows the command you can use to dump the trace. autrace also runs in a resource usage mode [5].
Command of the Month: mkgraph and mkbar
The Linux audit framework collects a lot of data – how do you get a sense of it? A picture is worth thousands of words and visualizing audit data would certainly be helpful.
Two simple scripts are available for these purposes: mkgraph [6] and mkbar [7]. Download the scripts and make them executable. The scripts are quite old and may need some tweaks to run on your box. If the commands below yield empty files, remove the -t switch to read commands inside the scripts. You may also want to adjust $EXT, which defines the output file format.
You'll need Graphviz for mkgraph and Gnuplot for mkbar, so install those from your package manager now. Comments in the scripts give you some usage examples. This is how you see which programs run which system calls:
LC_ALL=C aureport -s -i | awk '/^[0-9]/ { printf "%s %s\n",$6, $4 }' | sort -u | ./mkgraphThis uses awk to get the fourth and the sixth columns (syscall and comm) from the detailed system call report. Then, it removes duplicates and feeds the output to mkgraph. You can see the result in Figure 4. mkbar works the same way, but it draws bar charts, which are quite useful for quantitative metrics such as event count.
There are ways to build visualizations that look better. The mkgraph and mkbar tools aren't meant to be ready for your investor presentations, but they are nifty little tools you could use in your day-to-day work.
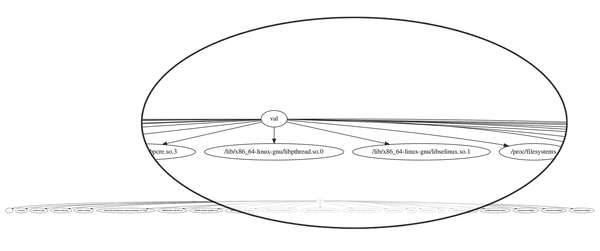 Figure 4: An mkgraph-generated flowchart showing some files a user has accessed. Not really aesthetic, but sometimes useful.
Infos
- "Filesystem Monitoring" by Valentine Sinitsyn, Linux Magazine, Issue 194, pg. 74.
- auditd.conf(5) man page: https://linux.die.net/man/5/auditd.conf
- aureport(8) man page: https://linux.die.net/man/8/aureport
- capabilities(7) man page: https://linux.die.net/man/7/capabilities
- autrace(8) man page: https://linux.die.net/man/8/autrace
- mkgraph home page: http://people.redhat.com/sgrubb/audit/visualize/mkgraph
- mkbar home page: http://people.redhat.com/sgrubb/audit/visualize/mkbar
« Previous 1 2
Buy this article as PDF
(incl. VAT)
Buy Linux Magazine
US / Canada
UK / Australia
Subscribe to our Linux Newsletters
Find Linux and Open Source Jobs
Subscribe to our ADMIN Newsletters
Support Our Work
Linux Magazine content is made possible with support from readers like you. Please consider contributing when you’ve found an article to be beneficial.

News
-
Linux Servers Targeted by Akira Ransomware
A group of bad actors who have already extorted $42 million have their sights set on the Linux platform.
-
TUXEDO Computers Unveils Linux Laptop Featuring AMD Ryzen CPU
This latest release is the first laptop to include the new CPU from Ryzen and Linux preinstalled.
-
XZ Gets the All-Clear
The back door xz vulnerability has been officially reverted for Fedora 40 and versions 38 and 39 were never affected.
-
Canonical Collaborates with Qualcomm on New Venture
This new joint effort is geared toward bringing Ubuntu and Ubuntu Core to Qualcomm-powered devices.
-
Kodi 21.0 Open-Source Entertainment Hub Released
After a year of development, the award-winning Kodi cross-platform, media center software is now available with many new additions and improvements.
-
Linux Usage Increases in Two Key Areas
If market share is your thing, you'll be happy to know that Linux is on the rise in two areas that, if they keep climbing, could have serious meaning for Linux's future.
-
Vulnerability Discovered in xz Libraries
An urgent alert for Fedora 40 has been posted and users should pay attention.
-
Canonical Bumps LTS Support to 12 years
If you're worried that your Ubuntu LTS release won't be supported long enough to last, Canonical has a surprise for you in the form of 12 years of security coverage.
-
Fedora 40 Beta Released Soon
With the official release of Fedora 40 coming in April, it's almost time to download the beta and see what's new.
-
New Pentesting Distribution to Compete with Kali Linux
SnoopGod is now available for your testing needs