
Set up your own lab environment with KVM, Qemu, and Libvirt
Setting up the Systems
When you get the VMs up and running, the next step is to install the applications that will run on three virtual systems: InfluxDB [2], collectd, and Grafana.
The InfluxDB packages are not part of the official Ubuntu repositories; however, a third-party repository contains everything we need. Execute the commands in Listing 9 as root on the influx01 VM.
Listing 9
Installing InfluxDB
# curl -sL https://repos.influxdata.com/influxdb.key | apt-key add -
# source /etc/lsb-release
# echo "deb https://repos.influxdata.com/${DISTRIB_ID,,} ${DISTRIB_CODENAME} stable" | tee /etc/apt/sources.list.d/influxdb.list
# apt-get update
# apt-get install influxdb
# cd /etc/influxdb/
# wget http://hoebel.net/downloads/articles/influxdb.conf
# mkdir /usr/share/collectd
# cd /usr/share/collectd/
# wget https://raw.githubusercontent.com/collectd/collectd/master/src/types.db
# systemctl restart influxdb
Now check if the InfluxDB application is running:
ps aux |grep influx
The next step is to log into the collectd01 system and set up the collectd daemon [3]. Collectd collects metrics of the local system and sends them to InfluxDB for permanent storage. Listing 10 shows the steps for installing the manic collectd collecting service on the collectd01 test system. Check to see if the daemon is actually running:
ps aux | grep collectd
If it isn't running, stop all collectd processes and relaunch the service.
Listing 10
Installing Collectd
# apt-get update
# apt-get install collectd collectd-utils
# cd /etc/collectd/
# wget http://hoebel.net/downloads/articles/collectd.conf
# systemctl restart collectd
After a few minutes of run time, the time-series database fills InfluxDB with metrics from the collectd01 test system. Check the status by running the influx command on the InfluxDB VM and listing all databases with show databases.
Use use collectd and show measurements to show which value categories ended up in the database. The quit command takes you back to the command line.
The virtual laboratory now collects metrics from one of the test systems and stores them in a database on another VM via the virtual network. The last step is to add visualization using Grafana [4].
Open a command line on the grafana01 test system and install Grafana (Listing 11). Line 1 sets up a software repository for Debian systems. (The system is Ubuntu, but Grafana developers have deliberately kept their package repository simple and have taken advantage of the fact that the package management works in the same way under Ubuntu and Debian.)
Listing 11
Installing Grafana
# echo "deb https://packagecloud.io/grafana/stable/debian jessie main" | tee /etc/apt/sources.list.d/grafana.list
# curl https://packagecloud.io/gpg.key | sudo apt-key add -
# apt-get update
# apt-get install grafana
# systemctl start grafana-server
After you launch Grafana, the service listens on port 3000. Open the http://172.100.100.31:3000 URL in a web browser, and you'll see a welcome to the login screen. Sign up as admin with the password admin and click on the Add data source link. In the Name field, enter the InfluxDB value and select the same value in the Type drop-down menu.
For URL, enter the http://172.100.100.21:8086 character string – Grafana will later reach InfluxDB under this address. Skip the configuration fields for Http Auth and, under InfluxDB Details, enter the name collectd in the Database field. Now press the green Add button and then Save & Test. Figure 8 shows the complete configuration.
 Figure 8: Configuration for Grafana data source.
You'll find a Grafana dashboard prepared for this configuration at my website [5]. Download the configuration file and click on the Grafana icon in the top left in Grafana. The icon opens a menubar where you select Dashboards | Import. In the next dialog, install the recently downloaded JSON file using the Upload .json File button. Don't forget to select the correct data source InfluxDB before clicking Import.
Next, Grafana guides you to the recently imported dashboard. Enter the collectd01 value under Host in the top left, or simply go to the link shown in Listing 12. Figure 9 shows the visualized data. The prefabricated dashboard displays all sorts of processed metrics for the collectd01 test system.
Listing 12
Point Grafana to the Data
http://172.100.100.31:3000/dashboard/db/server-operating-system-metrics?refresh=1m&orgId=1&var-host=collectd01&var-interval=$__auto_interval
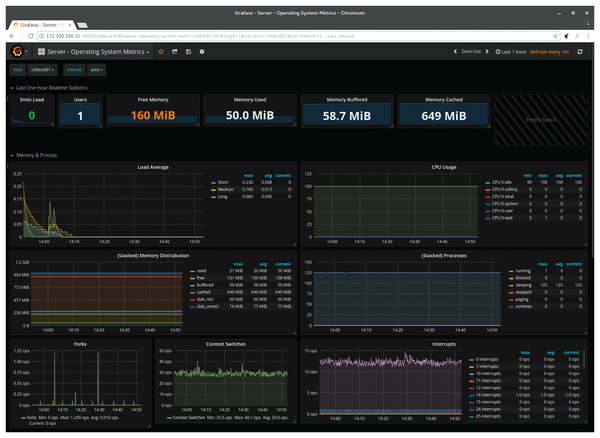 Figure 9: Grafana shows metrics to collectd01.
Conclusions
Creating a virtual test lab on your home computer requires less work than you might expect. Pay attention, take your time, and remain patient; you will very soon discover that the techniques described in this article will let you quickly configure and model complex test scenarios.
Infos
- Libvirt: https://libvirt.org/
- Official InfluxDB website: https://www.influxdata.com
- Collectd: https://collectd.org
- Grafana: https://grafana.com
- Grafana dashboard for the virtual lab: http://hoebel.net/downloads/articles/LinuxUser-Grafana-Dashboard.json
« Previous 1 2
Buy this article as PDF
(incl. VAT)
Buy Linux Magazine
US / Canada
UK / Australia
Subscribe to our Linux Newsletters
Find Linux and Open Source Jobs
Subscribe to our ADMIN Newsletters
Support Our Work
Linux Magazine content is made possible with support from readers like you. Please consider contributing when you’ve found an article to be beneficial.

News
-
TUXEDO Computers Unveils Linux Laptop Featuring AMD Ryzen CPU
This latest release is the first laptop to include the new CPU from Ryzen and Linux preinstalled.
-
XZ Gets the All-Clear
The back door xz vulnerability has been officially reverted for Fedora 40 and versions 38 and 39 were never affected.
-
Canonical Collaborates with Qualcomm on New Venture
This new joint effort is geared toward bringing Ubuntu and Ubuntu Core to Qualcomm-powered devices.
-
Kodi 21.0 Open-Source Entertainment Hub Released
After a year of development, the award-winning Kodi cross-platform, media center software is now available with many new additions and improvements.
-
Linux Usage Increases in Two Key Areas
If market share is your thing, you'll be happy to know that Linux is on the rise in two areas that, if they keep climbing, could have serious meaning for Linux's future.
-
Vulnerability Discovered in xz Libraries
An urgent alert for Fedora 40 has been posted and users should pay attention.
-
Canonical Bumps LTS Support to 12 years
If you're worried that your Ubuntu LTS release won't be supported long enough to last, Canonical has a surprise for you in the form of 12 years of security coverage.
-
Fedora 40 Beta Released Soon
With the official release of Fedora 40 coming in April, it's almost time to download the beta and see what's new.
-
New Pentesting Distribution to Compete with Kali Linux
SnoopGod is now available for your testing needs
-
Juno Computers Launches Another Linux Laptop
If you're looking for a powerhouse laptop that runs Ubuntu, the Juno Computers Neptune 17 v6 should be on your radar.