
Python network data visualization
Data Harvest

© Lead Image © Mark Bridger, 123RF.com
The Scapy packet manipulation program lets you analyze and manipulate packets to create incident response reports or examine network security.
Most folks have pulled up Wireshark a time or two to troubleshoot an application or system problem. During forensics, packet captures (PCAPs) are essential. Often you are looking at things like top talkers, ports, bytes, DNS lookups, and so on. Why not automate this process with Python?
Scapy [1] is a great tool suite for packet analysis and manipulation. It is most often talked about in the realm of packet manipulation, but its ability to analyze packets is also top-notch.
Make Ready
First, you need to make sure you have Python 3 installed along with the following packages:
sudo pip3 install scapy scapy_http plotly PrettyTable
To get started, you will want a PCAP to analyze. To capture 1,000 packets and save them to the file example.pcap, enter:
~$ sudo tcpdump -c 1000 -w example.pcap
tcpdump: listening on enp0s3, link-type EN10MB (Ethernet), capture size 262144 bytes
1000 packets captured
1010 packets received by filter
0 packets dropped by kernel
~$
Scapy can handle all parts of the OSI model except Layer 1 (Figure 1). Listing 1 shows the Hello World! of packet reading. To begin, you need to read a raw packet (line 5), see if it has the layer your want (line 9), and then act on it. Because you are using Python, if you try to print out pkt[IP].src when no IP is present, Python will throw an error, so you need to wrap it in a try/except (lines 10-13).
Listing 1
Looking for Layers
01 #Step 1: Import scapy
02 from scapy.* import all
03
04 #Step 2: Read the PCAP usimg rdpcap
05 packets = rdpcap("example.pcap")
06
07 #Step 3: Loop and print an IP in a packet in Scapy by looking at Layer 3
08 for pkt in packets:
09   if IP in pkt:
10     try:
11       print(pkt[IP].src) // Source IP
12     except:
13       pass
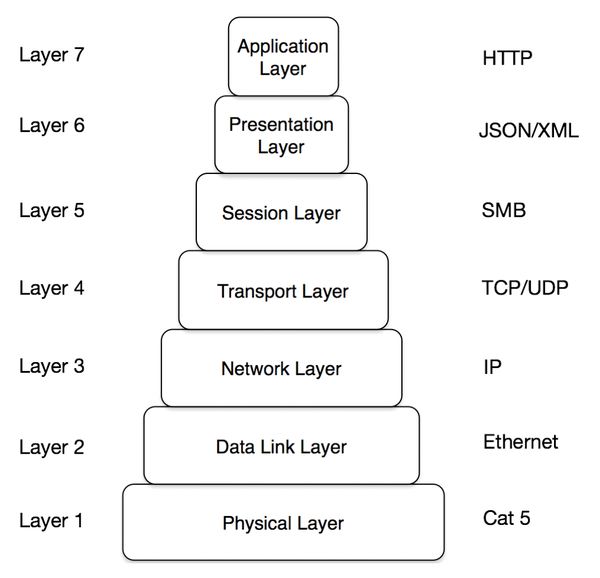 Figure 1: Check OSI Layer.
Sorting
If you ran the code in Listing 1 with your example.pcap file of 1,000 packets, your terminal printed ~1,000 lines, which is obviously not very useful. To improve, you can read all the IPs, append them to a list, then run a counter, and print the results using the PrettyTable module (Listing 2). As before, you import Scapy, but now you will also import the collection module and PrettyTable (Step 1). Next, add an empty list, and append (Step 2). Now you can use the counter to loop through the list of IPs and create a count (Step 3); finally, using the PrettyTable module, you print out the results in a clean table (Step 4).
Listing 2
Adding a Counter
01 #Step 1: Imports
02 from scapy.all import *
03 from prettytable import PrettyTable
04 from collections import Counter
05
06 #Step 2: Read and Append
07 srcIP=[]
08 for pkt in packets:
09   if IP in pkt:
10     try:
11       srcIP.append(pkt[IP].src)
12     except:
13       pass
14
15 #Step 3: Count
16 cnt=Counter()
17 for ip in srcIP:
18   cnt[ip] += 1
19
20 #Step 4: Table and Print
21 table= PrettyTable(["IP", "Count"])
22 for ip, count in cnt.most_common():
23   table.add_row([ip, count])
24 print(table)
25
26 +-----------------+-------+
27 |        IP       | Count |
28 +-----------------+-------+
29 |    10.0.2.15    |  482  |
30 |   52.84.82.203  |   93  |
31 |     8.8.8.8     |   82  |
32 |   104.16.41.2   |   76  |
33 |  216.58.216.232 |   30  |
34 |  104.20.150.16  |   20  |
35 |  52.84.133.105  |   16  |
36 |  209.132.181.15 |   16  |
37 | 140.211.169.196 |   15  |
38 |   72.21.91.29   |   12  |
39 |  104.244.46.103 |   12  |
40 +-----------------+-------+
Visualize
Now that you know how to read packets and do some counting, you can use the Plotly package to make graphs by building on the last example (Listing 3). First, you have to add the plotly import to Step 1 (line 1); then, after going through Steps 2 and 3 as before, you replace Step 4 in the previous example of Listing 2 with new code that creates two new lists to hold x and y data (Listing 3, lines 4-5) and loops through the IPs again, adding them to the lists (lines 7-9).
Listing 3
Making Graphs
01 import plotly
02
03 #Step 4: Add Lists
04 xData=[]
05 yData=[]
06
07 for ip, count in cnt.most_common():
08   xData.append(ip)
09   yData.append(count)
10
11 #Step 5: Plot
12 plotly.offline.plot({
13   "data":[plotly.graph_objs.Bar(x=xData, y=yData)] })
By default, Plotly uses its web UI to create charts, but if, like me, you use this data in a incident response situation, you do not want to share that data with a cloud system. Therefore, I use the offline version to plot my data in a new Step 5. When run, it will open your default web browser (Figure 2).
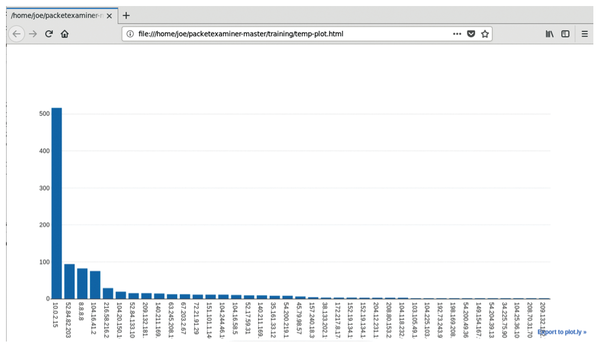 Figure 2: Offline plot of IPs.
Buy this article as PDF
(incl. VAT)
Buy Linux Magazine
US / Canada
UK / Australia
Subscribe to our Linux Newsletters
Find Linux and Open Source Jobs
Subscribe to our ADMIN Newsletters
Support Our Work
Linux Magazine content is made possible with support from readers like you. Please consider contributing when you’ve found an article to be beneficial.

News
-
Linux Servers Targeted by Akira Ransomware
A group of bad actors who have already extorted $42 million have their sights set on the Linux platform.
-
TUXEDO Computers Unveils Linux Laptop Featuring AMD Ryzen CPU
This latest release is the first laptop to include the new CPU from Ryzen and Linux preinstalled.
-
XZ Gets the All-Clear
The back door xz vulnerability has been officially reverted for Fedora 40 and versions 38 and 39 were never affected.
-
Canonical Collaborates with Qualcomm on New Venture
This new joint effort is geared toward bringing Ubuntu and Ubuntu Core to Qualcomm-powered devices.
-
Kodi 21.0 Open-Source Entertainment Hub Released
After a year of development, the award-winning Kodi cross-platform, media center software is now available with many new additions and improvements.
-
Linux Usage Increases in Two Key Areas
If market share is your thing, you'll be happy to know that Linux is on the rise in two areas that, if they keep climbing, could have serious meaning for Linux's future.
-
Vulnerability Discovered in xz Libraries
An urgent alert for Fedora 40 has been posted and users should pay attention.
-
Canonical Bumps LTS Support to 12 years
If you're worried that your Ubuntu LTS release won't be supported long enough to last, Canonical has a surprise for you in the form of 12 years of security coverage.
-
Fedora 40 Beta Released Soon
With the official release of Fedora 40 coming in April, it's almost time to download the beta and see what's new.
-
New Pentesting Distribution to Compete with Kali Linux
SnoopGod is now available for your testing needs