Access data from a weather station with the Raspberry Pi

Weather Watch

Author(s):

If you have a weather station that allows you to access data via a USB port, you can use your Raspberry Pi to analyze the data and publish the results via a web application.

My new weather station [1] has several sensors for wind, rain, and temperature, as well as a USB cable and evaluation software (Figure 1), albeit a desktop-only Windows application. However, I wanted to record the measured data and, if possible, access it on my cell phone while I was on the move.

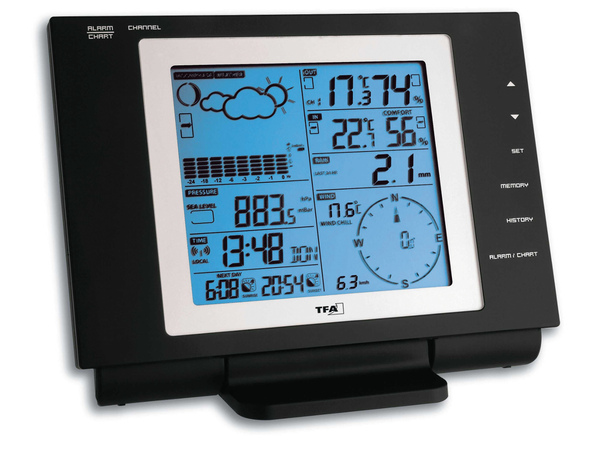
Figure 1: The electronic TFA Nexus weather station records wind, rain, and outdoor temperature and outputs the data via USB. (Image: TFA Dostmann)

Positioning a Windows PC running 24/7 next to my weather station was not an option; instead, I set my sights on the Raspberry Pi. Thus far, I had used it as a tiny media center with an equally tiny speaker, but by using its USB connection, my Pi could read the data output from the weather station. The power requirement is negligible compared with that of a full-size PC, and the Pi is silent. The question then arose: How can I acquire the data via USB if the station only comes with a Windows program?

Pi Configuration

Your Raspberry Pi can be freshly installed with the official recommended Debian Raspbian "wheezy" image from the Download page on the Raspberry Pi website [2]. The tool set necessary to complete this project comprises a C program, Ruby, the Sinatra web application library, a database, and graphing software, all of which are introduced in the "Ingredient" sections of this article. Figure 2 shows how all the components interact and fit together.

Figure 2: The components of the Raspberry Pi weather station project.

Note that you do not have to install a web server. The Ruby script in Listing 4 is the complete web server and web application; Sinatra loads a simple web server for the application when the script is executed (see "Ingredient 3").

Ingredient 1: A Small C Program

A small program written by John Sebastian named te923tool [3] can read the data output by many weather stations based on HIDEKI. With some minor niggles, the program also works for my TFA Nexus. I only needed to compile the source code on my Raspberry Pi. For this to work, you need the developer tools gcc , make, and libusb-dev.

After unpacking the archive, calling make should give you the te923con program. A test with the te923con -h command not only informed me as to whether the program was running, it also provided detailed help for the program. If all is well, a call without any parameters returns the measured data:

$ sudo ./te923con
1363468817:20.40:50:i:i:i:i:i:i:i:i:-1.90:60:1008.0:i:5:0:14:0.4:0.6:-3.8:115

You will need to use sudo here because access to the USB port requires root privileges.

Notice the values between the colons. The Help function explains that an "i" stands for values that could not be assigned. Although the first field is not explained, it is Unix time (i.e., the number of seconds since the Unix epoch, or January 1, 1970). Calling

date -d @1363468817 +%c

in the terminal converts this number into a legible date: Sat 16 Mar 2013 22:20:17 CET.

In a cron job, I run te923con and redirect the output to a text file named weather.csv, which a Ruby script then uses to populate a database.

Ingredient 2: Ruby

Ruby is the perfect way to process data and feed it to a web server. The numerous libraries that can be installed via Ruby's own package management system, RubyGem, include the ActiveRecord database interface and Sinatra web server. These two libraries later provide the core of the application. Ruby can be installed on the Raspberry Pi from the Debian repositories; however, for a more recent version that is easier to manage, you need the Ruby version management system rbenv [4].

Because rbenv is installed from a GitHub.com source, you need to install the git package up front. Some Ruby libraries are also compiled before the installation on the target system. To be able to install additional libraries later, you will also want to install the zlib1g-dev, libsqlite3-dev, libssl-dev, and libreadline6-dev libraries as Debian package sources.

For instructions on installing rbenv, check out the program website; then, you can run

rbenv install 2.0.0-p0

to install the current version of Ruby. On the Raspberry Pi, that can take a while. Before you can use Ruby, you need to call

rbenv global 2.0.0-p0

to define this version as the default for the user. A test with ruby -v shows that the installation worked.

Ingredient 3: Build a Web Application with Sinatra

Once Ruby is installed, Ruby libraries are managed with gem. To program web applications with Sinatra, you need to run

gem install sinatra

to install the Sinatra gem. This sample full-fledged web application,

require 'sinatra'
get '/' do
  'Hello world!'
end
}

can be accessed in the browser on http://localhost:4567/ after typing ruby webapp.rb.

Ingredient 4: Populate a Database with Measured Values

Now, you still need to store the data in an appropriate way. In general, a database is used for web applications. SQLite is a database designed for simple applications, but that still speaks SQL. The database is part of the Debian sqlite3 package. To use it in Ruby, you also need the Ruby sqlite3 gem.

To create a new database file by the name of db.sqlite3 which will store temperature values at specific times, for example, you would type:

sqlite3 db.sqlite3 'create table temperatures(time integer, t real);'

The Ruby code in Listing 1 [5] uses ActiveRecord to access the database and populate it with values parsed from a CSV file, weather.csv. The rows in the CSV file containing the data from the weather station are structured as described above.

Listing 1

Populating the Database


The beauty of ActiveRecord is that it automatically takes care of everything you need for reading and writing to databases. In Listing 1, on seeing the Temperature class, it understands that it needs to access the temperatures table, and the variable names (time, t) tell it the columns in the database table that it must write.

Ingredient 5: Read Measured Values from the Database

The data can be read conveniently from the database, again thanks to ActiveRecord. Listing 2 reads all entries in the values variable at one fell swoop. At the same time, the time values are multiplied by 1,000.

Listing 2

Read from a Database


The array comprises pairs of times and measured values, so it can later be interpreted by the chart library to provide data points. The inspect method generates a matching string from the array ("[[1363465023000, -1.3], [1363468623000, -1.9], ...]"). In Listing 2, this string is output in the terminal. Later, the string is integrated into the website at the appropriate point in the JavaScript code.

Displaying Data Charts on Websites

Creating charts from the data and then embedding them in a web page can be done several ways. With Gnuplot, for example, a script could generate a graphic file, which is then embedded as an image in the website.

Google Charts provides a way to transmit the data to a web interface and returns an image file. You do not need graphics applications on your own web server in this case. I decided on a third option and used the Highcharts JavaScript library [6] to generate the charts.

Highcharts provides very attractive results. Although use for commercial purposes is a little expensive, private use is licensed free of charge by Highsoft Solutions AS under the "Creative Commons Attribution-NonCommercial 3.0 Unported" license.

Listing 3 creates a graph of a temperature profile over 24 hours. All it takes is to embed the two JavaScript libraries, jQuery and Highcharts. The chart itself is defined as a JavaScript function. The only special feature is the identification of the x-axis as date values and embedding the data values. A data value consists of the time and the temperature. The time data from the weather station previously had to be multiplied by 1,000 because JavaScript expects the values in milliseconds, and the measured data are stated in seconds.

Listing 3

Highcharts JS Graph


All Together Now

The ingredients described thus far make up the core of the application. What is still lacking is essentially regular data updates and interaction between the ingredients described above. A simple web application that reads data from the database and generates the corresponding chart is shown in Listing 4.

Listing 4

Generating the Chart as a Web App


The Sinatra web application is in lines 10 to 16. The call to inherit **:index embeds the data in the website. The website is then embedded in the script in line 21. Then, inherit replaces the code in line 32, <% = @data%>, with the contents of the @data variable. The result in the browser is shown in Figure 3.

Figure 3: A Highchart diagram in a Sinatra web application.

The only question that remains is how to collect the data regularly, which is handled by the previously mentioned cron job with an hourly call to the script in Listing 5.

Listing 5

Cron Job


This script is stored in the directory /etc/cron.hourly and tagged as executable using:

sudo chmod a+x crontab_pi

The load_data script, executed as a cron job, acquires the measured data, writes it to a CSV file, and uploads the file to the database.

Listing 4 shows how Sinatra can create a full-fledged web application with relatively little code. The rest of the process is hard work and involves acquiring the other readings from the weather station and cleaning up the code a little. In the end, the code might look like that shown in Figure 4.

Figure 4: The weather data in the finished application.

Extensible

I have published the preliminary results of my weather application as source code on GitHub.com [7]. To download and test the code with Git, call

git clone git://github.com/rheikvaneyck/rnexus.git

to create a local copy. You can update later with:

git pull

The code needs improvements in many places, but it provides insight into some ways to use your Raspberry Pi to build your own web applications.

The Author

Marcus Nasarek is a security professional and very much into shells and scripting languages.