Filtering log messages with Splunk

Needle in a Haystack

Author(s):

Splunk has mastered the art of finding truly relevant messages in huge amounts of log data. Perlmeister Mike Schilli throws his system messages at the feet of a proprietary analysis tool and teaches the free version an enterprise feature.

To analyze massive amounts of log data from very different sources, you need a correspondingly powerful tool. It needs to bring together text messages from web and application servers, network routers, and other systems, while also supporting fast indexing and querying.

The commercial Splunk tool [1] has demonstrated its skills in this field even in the data centers of large Internet companies, but the basic version is freely available for home use on standard Linux platforms. After the installation, splunk start launches the daemon and the web interface, where users can configure the system and dispatch queries, as on an Internet search engine (Figure 1).

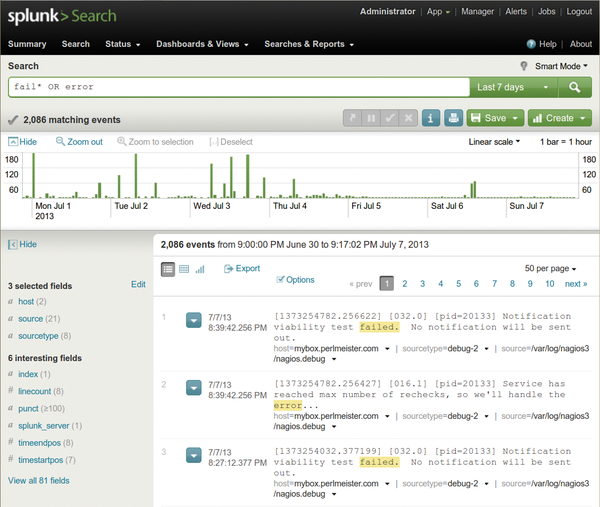
Figure 1: Following a search command, Splunk presents the errors recorded in all real-time-imported logs.

Panning for Gold

Easy and fast access to geographically distributed log messages via an index on a local search engine helps detect problems quickly. The powerful search syntax supports not only full-text searches against the database but also in-depth statistical analysis, like, "What are the 10 most frequently occurring URLs that all of my web servers together have delivered in the past two hours?"

Oftentimes, interesting news get drowned in a sea of chatty logfiles. With Splunk, users can gradually define event types that they are not interested in, and the tool removes them from the results. Event types also can be combined to create higher level search functions, so that even Splunk novices can expand their queries with new filters after a short training period, much like real programmers. After some panning of the flow of information, often a few handy nuggets will finally see the light of day. Caution: The free basic version could be a gateway drug to lure you into paying for the Enterprise version one day.

Structured Imports

Splunk interprets the lines of a logfile as events and splits up messages into separate fields. For example, if the access log of a web server contains GET /index.html, then Splunk sets the method field to GET and the uri field to /index.html (Figure 2).

Figure 2: Splunk takes apart the lines in a web server access log at their field boundaries.

Splunk natively understands a number of formats such as syslog, the web server error logs, or JSON, so that the user does not need to lift a single finger to structure and import this data. To import local logfiles of any Linux distro, go to the Add data menu and configure a directory such as /var/log (Figure 3). The Splunk indexer then assimilates all the files below this level. If the files change dynamically, the Splunk daemon also grabs the new entries; queries now also cover the new information.

Figure 3: Adding all the logfiles in /var/log to the Splunk index in the Add new dialog.

You can import other formats by instructing Splunk, for example, to use regular expressions to extract fields from message lines. Splunk also adds internal meta information to the existing fields in the log entry. For example, the source field of an event defines the file from which the information originates (if it comes from a file, that is), and host defines the server that generated the event and therefore created the log entry in the first place.

Less Than 500MB or Pay Up

The free version of the Splunk indexer digests up to 500MB of raw data per day; if you feed more to it, you are in violation of the license terms, and it will not work more than three days a month. If you nevertheless risk doing this, Splunk turns off the search feature, forcing you to purchase an enterprise version. Its price is amazingly high; large amounts of data in particular could tear large holes in your budget. In Silicon Valley, the rumor is that Splunk has many large corporate clients, despite the high cost, because the benefits of efficiently finding needles in an absurdly large haystack are very valuable to them.

Steadily Refined

For this month's column, I installed Splunk at home on my Ubuntu machine. Figure 1 shows how I searched the log data in /var/log and the Apache access logs provided by my hosting provider, which I copied using rsync. Without any ado, Splunk consumed rotated and zipped logs as well.

The first query I issued was fail* OR error. This full-text search finds messages that contain the term error. Splunk is not case sensitive for search strings, but it does expect keywords, such as OR, to be uppercase. The regular expression fail* matches all terms that begin with fail – including failed. Without keywords, Splunk connects the strings with a logical AND; foo bar thus finds log entries that contain both foo and bar. The logical operator OR must be written all in uppercase and combines messages that contain either search term. The results in Figure 1 cover the time frame shown at top right, Last 7 days.

All of these results are from the extremely verbose Nagios debug log (nagios.debug). To filter them, the dialog in Figure 4 defines the nagios-chatter event type with the search function source=.../nagios.debug (seen on the darkened background). Splunk then internally associates all entries from the original nagios.debug file with the event type. If you then append the expression NOT eventtype=nagios-chatter to the query, the event search filters out any Nagios chatter.

Figure 4: All lines from the nagios.debug logfile (in the darkened area) are associated with the nagios-chatter event type.

The next application spamming the logfiles was my nightly backup process. The rsync command I used here seemed to be unable to copy some files because of a lack of access rights, which filled the backup.all.log file every night. Thus, I needed an event type called rsync-chatter to filter that out.

To keep the search commands short, I defined the chatter event type, which uses

eventtype="nagios-chatter" OR
eventtype="rsync-error"

to combine the two filters. This means that I just need to append NOT eventtype=chatter to my query to hide all this log chatter with the help of an arbitrarily extensible filter. The messages from /var/log/messages shown in Figure 5 remain; they report failed password attempts and seem to merit deeper manual analysis.

Figure 5: Without nagios-chatter and backup-rsync-error, only the important events remain.

Scaling with Hadoop

Sure, you could argue that instead of reading a mess of data in /var/log, it would be easier just to read the correct file, /var/log/auth.log. The great advantage of Splunk, though, is precisely that it stores all (!) your logfiles  – even those from entire server farms  – and lets you run queries against them all at once.

For this approach to work well in large data centers, Splunk uses a Hadoop cluster [2] [3] as its back end, which distributes the complicated computation of the search results across multiple nodes.

The web interface allows end users without programming skills to select fields and define limiting filters graphically. Splunk permanently stores all user entries in the configuration files in etc under the Splunk installation directory (Figure 6). As you gradually develop your own definitions, you would do well to back up these files with a source control system such as Git occasionally, so you can roll back if you realize that what you just changed was a bad idea.

Figure 6: Splunk stores definitions created in the web interface in readable configuration files.

The Poor Developer's Splunk Alert

Unlike the enterprise version, the free version of Splunk does not provide alerts that notify the user when queries exceed set limits. The script in Listing 1 [4], however, will help those on a more frugal budget; it runs on the same machine and periodically taps into Splunk's web API. Splunk sends the results in JSON format, and the script reformats them and mails them out. In other words, Splunk can run on your home computer behind a firewall, while a local cronjob periodically fires off queries and sends the results to a recipient anywhere on the Internet.

Listing 1

daily-incidents


To begin, the script in Listing 1 needs to identify itself to the Splunk REST API. A fresh installation sets admin (account) and changeme (password) for the web GUI by default. The script executes the login as an HTTPS request. Line 11 defines the server running the REST API as 127.0.0.1; line 12 sets the Splunk server port to 8089.

The post() method called in line 31 uses SSL to send the login data to Splunk. Because the LWP::UserAgent CPAN module does not come with browser certificates by default, line 29 sets the verify_ hostname option to 0, which prevents the certificate check from happening.

Splunk returns the results of the login as XML, and the XMLin() function from the CPAN XML::Simple module in the script converts the XML into a data structure. After a successful login, the structure contains a sessionKey field. The key contains a hexadecimal number that must accompany each following REST request for Splunk to recognize it as belonging to a logged-in user. The UserAgent's default_headers() method handles this automatically for all subsequent requests.

The tutorial on the Splunk website [5] describes the details of the REST API. Although the Splunk SDK has client libraries for Python, Java, JavaScript, PHP, Ruby, and C#, it lacks a Perl kit. A module is available on CPAN, but it does not work with Splunk version 5. Fortunately, REST queries are easy to program, and Listing 1 thus uses this layer.

Search with Remote Control

The post() method in line 57 sends a search command to the Splunk server. In contrast to the web GUI, searches submitted via the API need to start with the search command. Besides the NOT eventtype=chatter filter that I already described, it defines the restriction earliest=-24h; that is, it only asks for events in the past 24 hours. As defined by the output_mode parameter, I want Splunk to return the results in JSON format. If you prefer to avoid lengthy emails, you will also want to restrict the number of hits to 50 using limit=50.

The from_json() function from the JSON CPAN module then converts the results to Perl data structures one line at a time in line 82. Three fields are crucial for the mail to be sent: the time stamp of the log entry with the _time key, the logfile in source, and the original log line in _raw.

The Net::SMTP module from CPAN sends the mail with the results of the search to the target defined in $to_email. The SMTP server $smtp_server was set previously in line 23.

For Dinosaurs and Hipsters

Complex HTML messages annoy old codgers like me that use text-based email readers such as Pine. Conversely, a plain text email is too old school for young, dynamic Outlook and Thunderbird mouse pushers. To mediate between the two worlds, Listing 1 formats the tabular results of the query in ASCII using the CPAN Text::ASCIITable module. To prevent the timestamp column from becoming too long, and to wrap it instead, line 76 limits its width to a maximum of 10 characters. The same thing applies to the column with the log entry, which wraps to a line length of 34, keeping messages readable, even on mobile phones.

Some modern mail readers prefer HTML, and to satisfy them, line 96 calls the CPAN Email::MIME module. It wraps the existing ASCII text in inline HTML, surrounded by simple pre tags. Thus, the results are acceptable both in Alpine (Figure 7) and in Gmail (Figure 8).

Figure 7: Text-based formatting for a venerable mailer like Alpine.
Figure 8: HTML formatting for modern mail readers; Gmail shown here.

The script can be easily extended to include tests that compare the values found with previously set limits and then only send messages when the limit is exceeded. This can happen once per day as a summary or at five-minute intervals for rapid-alert email messages.

Some open source alternatives to Splunk, such as Logstash [6] [7] and Graylog2 [8], are also available, but so far they do not come close to Splunk in terms of ease of use and scalability.

Infos

  1. Splunk: http://www.splunk.com
  2. Hadoop: http://hadoop.apache.org
  3. "Giant Data: MapReduce and Hadoop" by Thomas Hornung, Martin Przyjaciel-Zablocki, and Alexander Schätzle: http://www.admin-magazine.com/HPC/Articles/MapReduce-and-Hadoop
  4. Listings for this article: ftp://ftp.linux-magazin.de/pub/listings/magazine/155
  5. "Splunk: Intro REST API tutorial": http://dev.splunk.com/view/SP-CAAADQT
  6. Logstash: http://logstash.net
  7. "Centralized Log Archiving with Logstash" by Martin Loschwitz, Linux Magazine, June 2013, p. 60: http://www.linux-magazine.com/Issues/2013/151/Logstash/(language)/eng-US
  8. Graylog2: http://graylog2.org

The Author

Mike Schilli works as a software engineer with Yahoo! in Sunnyvale, California. He can be contacted at mailto:mschilli@perlmeister.com. Mike's homepage can be found at http://perlmeister.com.