Perl scripts analyze Jawbone UP data

Moving Circle

Author(s):

The Jawbone UP electronic bracelet measures the wearer's daily activity and nocturnal sleep patterns. If you are bored by the official smartphone app, you can create your own Perl scripts and access your data via the unofficial web API.

To counter the widespread tendency to excessive body fat, many smartphone owners now carry little gadgets around with them, reminding them of their lack of physical activity during the day. If you sit motionless for hours in front of the screen, the idea is that such a device could motivate you to walk around the block more often, or at least use the upstairs bathroom. This trend toward self-measurement – known as quantifying yourself – has grown very popular lately.

An electronic bracelet like the UP [1] by Jawbone measures the steps you take and shows the distance traveled and calories burned in the associated smartphone app (Figure 1). The accessory is available in three sizes and several colors and costs about US$ 130. From a functional point of view, the device seems to capture only instantaneous acceleration values and accumulates them over time. The geographical position of the wearer could be determined with a GPS chip, but this added function would probably drain the device's small battery in next to no time.

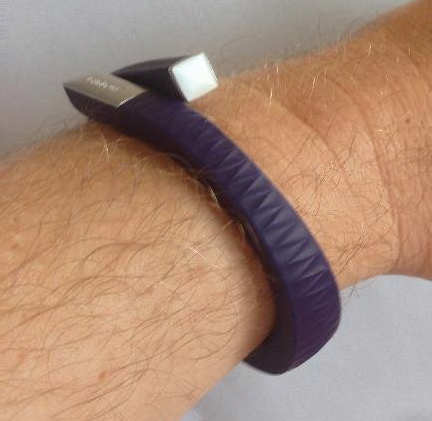
Figure 1: The Jawbone UP bracelet tallies its wearer's physical activity during the day by tracking acceleration.

Under the Hood

As a specialist in lifestyle gadgets, Jawbone is not exactly a proponent of open hardware; but in a YouTube video [2], an inquisitive geek slit open the outer rubber shell of the bracelet to reveal the waterproof sealed components inside (Figure 2). In the course of this operation, the bold explorer found half a dozen smaller mini-PCBs with SMD components, but apart from an accelerometer, the lithium-ion battery and charger chip, a vibration device, and components for docking to the audio port of the smartphone, nothing flashy was revealed.

Figure 2: On YouTube, a hobbyist demonstrates how to dissect a Jawbone UP band and explains its components.

In other words, after connecting to the smartphone, the bracelet simply sends the timed acceleration data to a machine learning system in the Jawbone cloud, which then looks at the movement patterns and guesses by the type of movement (walking, running, elliptical trainer) how many steps the wearer managed and what distance was covered.

Sleep of the Just

If you wear the UP band at night, you can marvel at your sleep patterns in the morning. The app shows graphically when you went to bed, when you fell asleep, and how many times you woke up or got up during the night. Upon request, the band can wake you with a gentle vibration within a 20-minute period in the sleep cycle when waking up will cause the least pain.

To detect the sleep pattern, however, you first need to press a button to switch the device manually to sleep mode. If you do not move for a long time after this, you are probably fast asleep; if smaller movements are detected, you are in a lighter phase of sleep.

The built-in battery lasts for about a week without recharging. To read the data, you need to pull the silver cap off one end of the UP to reveal an audio connector. You then plug the connector into the audio port on your smartphone (Figure 3) and launch the app. The UP sends the movement data to the app, which forwards it to the server in the Jawbone cloud. The app receives the processed data and displays it in nicely arranged graphs (Figures 4 and 5).

Figure 3: If the bracelet audio plug is plugged into the socket of the smartphone while the UP app is running, it transmits the data.
Figure 4: The smartphone indicates not enough sleep, but the wearer has almost reached his goal of 10,000 steps per day.
Figure 5: Got to bed at 1:20am, then woke up at 6:30am, started reading a book, then dozed off and woke up again at 10:00am.

You can share the information that UP gathers with other users. For example, runners can invite friends to join their "team" and organize fitness competitions. If you prefer not to let your colleagues know that you spent the whole night tossing and turning in bed, you can exclude this delicate information from publication in the Sharing section.

Open Data

The device is interesting for hobbyists because the step and sleep data is available not only via the app but also in a raw format. To access the data, the script in Listing 1 calls on the CPAN WWW::Jawbone::Up module, and thus indirectly an unofficial web API that imports the transaction data into a Perl script [3]. Running ./uptest at the Linux command line allows the experiment-friendly fitness enthusiast to quickly query the data they have already uploaded:

Listing 1

uptest


Mike Schilli walked 8.597km today
Mike Schilli slept for 6h19m last night

Listing 1 starts by loading the CPAN module and then logs in to the UP cloud using the connect() method. You need to replace the email address and password in lines 11 and 12 with your UP user account credentials, which you created when you activated your UP. The user() method retrieves the registration data of the logged in user. The name() method extracts the user's first and last name.

The score() method then pulls the processed motion data from the UP server. The distance traveled by the wearer in the past 24 hours can be queried in kilometers using move()->distance(). If you prefer miles, you can simply multiply the value by 0.62.

The sleep duration in seconds is provided by sleep()->asleep(). The next line divides the value by 60 to arrive at minutes, and the CPAN module DateTime::Duration converts the resulting value to hours and minutes. It refuses to cooperate with seconds because this could lead to errors in special cases (because of leap seconds), so you need this trick to get it to cooperate.

Graphing Activity

With all this data available, you can now indulge in all kinds of neat experiments. For attractive charts, you just need a graphics package such as Chart::Clicker [4] to generate aesthetically pleasing results without much manual work. Figure 6 shows two graphs in a chart with the distance covered during the past 24 hours in purple and the steps measured dynamically at fixed intervals in yellow.

Figure 6: Distance traveled in the past 24 hours (purple) and steps counted in dynamically selected measurement intervals (yellow).

To save space on the device, the UP saves data sets in measurement intervals of varying length: If nothing happens for a long time, while the wearer is sleeping or watching television, the time window with the movement count can be one hour or longer. At full speed, however, the bracelet writes an entry to memory every minute to record the number of steps. The UP server estimates the distance covered by the UP wearer, the average speed, the calories burned during the activity, and the number of seconds in which the user was active in the time interval.

All of this information is tapped by the script in Listing 2 and rendered in graphical form using the chart package. The Chart::Clicker package from CPAN draws beautiful curves and is so flexible that it can even bundle two types of graphs in a single chart, as shown in Figure 6.

Listing 2

bandchart


A rendering engine called Chart::Clicker::Renderer::Area plots the number of meters covered over a timeline as a filled area (purple in Figure 6), and the graph shows the spikes of step count values as thin bars in yellow, also over the time axis.

On the Move

Left to its own devices, Chart::Clicker represents data as xy coordinates. If the x-values take the form of dates in Unix seconds, the Chart::Clicker::Axis::DateTime module ensures that they appear on the x-axis in a neat day or time data format.

The script uses the band() method in line 31 to fetch the raw data for the past 24 hours from the bracelet. Optionally, an arbitrary time window could be defined. The results are an array of entries, each containing a reference to a hash  – with steps for the number of steps per period of time, distance for the distance traveled, and speed for the average speed during the measurement period. The time method fetches the timestamp, active_time the portion of the time window in which the user was active, and calories the number of calories burned.

The script then fills three arrays with the retrieved values: @time with the timestamps in Unix format, @steps with the step count at these times, and @distance with the total distance covered up to the point in time. Lines 56 and 70 generate one data series each of the type Data::Series from the time-step or time-distance combinations.

A record of the Data::DataSet type for a graph can store multiple data series in Chart::Clicker, but lines 56 and 64 respectively generate one data set with only one series each for the two graphs. The script wants to render these differently – one as an area graph and the other as a bar chart  – but in the same diagram.

Rendering in Context

Chart::Clicker works in contexts to render the graphs; default is the preset, and line 53 picks up an object of the same name. To render the second data set, line 80 defines an additional context named steps; line 83 adds it to the system. Lines 88 and 89 then call add_to_datasets() to add both series to the Clicker, and the domain_axis() method assigns the two to the Axis::DateTime time axis via the context. The time axis then interprets the x values of data series as date values and renders them accordingly.

The %H:%M specification tells the formatter to plot only the hours and minutes of the Unix date in the axis. The time zone America/Los_Angeles is for the San Francisco area and may need to be adapted to your location. The time zone name matches the Olson database on which the DateTime module is based; the Wikipedia page [5] lists the values for Europe and the rest of the world.

Two in One

The context is what enables the magic trick with the two graph types: Line 111 assigns the area renderer to the default context, and the steps context gets a bar renderer in line 112. In both cases, the opacity parameter determines the transparency of the graph: With values around  , the lines and areas are virtually opaque; they turn completely transparent at around 1.

The graphically enhanced motion data in Figure 6 shows that I ran down to nearby Dolores Park after work to put a few miles on the UP. In a normal day at the office, hardly anyone will achieve the recommended 10,000 steps. As you can also see, the UP accumulated almost zero steps during the evening I spent lounging in front of the TV.

After a nice long sleep until 8 o'clock in the morning, I walked the half mile to the Yahoo! shuttle stop in San Francisco. During the day, the measured walking distance increased very slowly, while I meandered between meetings in different rooms or even buildings. After work, I walked uphill from the bus stop to my home; and the number of steps taken continued to grow, finally reaching about 10,000 at the end of the day.

Under Construction!

If you buy the Jawbone UP band, do not expect a 100 percent mature product. In discussion forums, more than a few owners reported that their slender bracelets stopped working at some point. In particular, the first versions had apparently catastrophic error rates; newer ones are more reliable, but it's not uncommon to hear that individual UPs fail to charge their batteries or stop responding. The fact that the Jawbone customer service department does not always respond as expected fails to inspire confidence. But, give it a shot!

A competitor for the UP has been available for quite a while in the form of "The One" by Fitbit [6]. You can drop this small USB stick format gadget into your pocket during the day and bind it onto your arm at night using a fairly wide fabric ribbon.

Infos

  1. Jawbone UP: https://jawbone.com/up
  2. "Jawbone UP Pedometer Teardown," EEV Blog #412: http://www.youtube.com/watch?v=sRjHAGsl6ws
  3. Listings for this article: ftp://ftp.linux-magazin.de/pub/listings/magazine/153
  4. Chart Clicker: http://gphat.github.io/chart-clicker/
  5. Time zones in the Olson database: http://en.wikipedia.org/wiki/List_of_tz_database_time_zones
  6. Fitbit One: http://www.fitbit.com/one

The Author

Mike Schilli works as a software engineer with Yahoo! in Sunnyvale, CA. He can be contacted at mailto:mschilli@perlmeister.com. Mike's homepage can be found at http://perlmeister.com.