Calculating Probability

Perl – Think Again

Author(s):

To tackle mathematical problems with conditional probabilities, math buffs rely on Bayes' formula or discrete distributions, generated by short Perl scripts.

Features

The Monty Hall problem is loved by statisticians around the world [1]. You might be familiar with this puzzle, in which a game show host offers a contestant a choice of three doors – behind one door is a prize, but the other two doors only reveal goats. After the contestant chooses a door, the TV host opens a different door, revealing a goat, and asks the candidate to reconsider (Figure 1). Who would have thought that probabilities in a static television studio could change so dramatically just because the host opens a door without a prize?

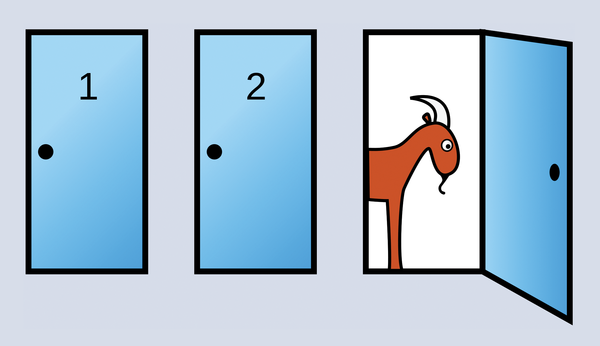
Figure 1: Hoping to win the car, the contestant chooses door 1. The host, who knows which door leads to the car, then opens door 3, revealing a goat. He offers the contestant the option of picking another door. Does it make sense for the contestant to change their mind and go for door 2? (Source: Wikipedia)

The human brain seems to struggle with conditional probabilities like these, which describe random events with preconditions. It's just like a task I set up in a Perl column 15 years ago, which involved a top hat with three cards inside. The first card is black on both the front and back, the second card is red on front and back, and the third card red on one side and black on the other (Figure 2). One card is drawn. You can see the front, which is red. What is the probability of the back of the card also being red?

Figure 2: A test candidate draws a card from a top hat with one black-and-red, one black-and-black, and one red-and-red card.

Counterintuitive

Most people immediately respond "50 percent," because there are apparently two equally probable cases: the red-and-black card and the red-and-red card – that is, the opposite side is black in one case and red in the other case. To many people's surprise, however, the correct answer is "66 percent." The clue lies within the preconditions of the experiment: The red-and-red card is drawn twice as often in comparison to the red-and-black one, because it meets the precondition of the experiment – one side is red – on both sides, whereas the red-and-black card only gets drawn one-third of the time.

More than 250 years ago, the mathematician Thomas Bayes tried to express such intuitively error-prone problems in an immutable formula. The Bayes' theorem [2] describes in its "diachronic interpretation" how the probabilities of hypotheses change over time, as you encounter new data in an experiment. The formula

P(H|D) = P(H) × P(D|H)/P(D)

defines the probability P of a hypothesis H, for example, "I have drawn the red-and-red card," under the condition of newly emerging data D, such as "The front of the drawn card is red" (Figure  3).

Figure 3: Bayes' theorem defines the probability of a hypothesis in response to newly emerging data. (Source: Translated from German Wikipedia)

On the right-hand side of the equation you see P(H), the probability of the hypothesis, before new data become available. Bayes multiplies it by P(D|H), that is, the probability that the data are available under the hypothesis. How likely is it, for example, that the person drawing the cards actually will see a red front if they have drawn the red-and-red card?

The denominator on the right side, P(D), is the probability of the available data, independent of any hypothesis. How likely is it that the candidate will see a red front after drawing any card?

Clever Bayes

All three possible hypotheses – randomly drawn cards – are obviously equally likely in this experiment. In other words, P(H) – the probability that the red-red card is drawn – is equal to 1/3, because it is drawn in one third of all cases. Assuming this hypothesis, the flip side of the drawn red-red card is trivially also red in exactly 100 percent of all cases; that is, P(D|H) = 1.

Regardless of the hypothesis of one drawn card, the probability of seeing a red card surface after drawing is 50 percent, that is, P(D) = 1/2. After all, there are six card sides in the hat, three of which are red, and three black. If you substitute this into the Bayesian formula, the result for P(H|D) is thus 1/3 × 1/(1/2) = 2/3. Thus, the formula predicts the experimentally demonstrable correct result of 66 percent and contradicts our intuition.

Probability, Discretely Programmed

Think Bayes [3], which was published about six months ago, not only explains the Bayesian formula but also describes a numerical method that is easy to use for experiments with short software programs. To do this, you store the hypotheses as statistical distributions, that is, in a Python dictionary or Perl hash, along with their probabilities.

As additional data becomes available, the stored values are then multiplied by the conditional probability of the incoming data, under the assumption that the individual hypothesis is true. Later, the program normalizes all values so that they add up to 1, or 100 percent.

The result is the probability of all hypotheses in the light of the incoming data. This process and specifically the final normalizing step can only be used, however, if:

  • not more than one of the hypotheses is true, and
  • there are no other options; that is, at least one of the hypotheses is true.

Listing 1 [4] shows the implementation of the cards script, which prints the correct solution, 0.666. It uses the Distrib.pm module (Listing 2), which provides auxiliary functions for computing the statistical distribution. The probabilities for the hypotheses of drawing different cards (BB, BR, RR for black-black, black-red, red-red) are fed to the module in lines 7-9, each with a value of 1/3.

Listing 2

Distrib.pm


Listing 1

cards


Lines 11-13 of Listing 1 define the incoming data (i.e., the probabilities that the front sides of the drawn cards are red) for each hypothesis and multiply the supplied hypothesis values by them. Thus, the probability of the subject seeing a red front on the black-black card is zero. The probability is 50 percent for the black-red card, depending on which way the card faces coming out of the hat. The red-red card shows red in 100 percent of all cases, which is why line 13 sets the multiplier to a value of 1.

Finally, the call to the prob("RR") method returns the normalized probability of the hypothesis red-red card, which is 2/3.

Moose Gimmick

Listing 2 uses the CPAN Moose module, which saves me from having to code the Distrib constructor in Perl. However, the code instead needs to use has (line 3) to declare and initialize the class attributes. This is just a neat gimmick in the present case; for more attributes, however, the code would be much leaner than manually creating classes.

The set() method expects the name of a hypothesis (e.g., BB) and its a priori probability and stores this in the object's internal values array. To multiply a hypothesis value by a constant value, both are passed to mult(); it finds the previously stored value in values and multiplies it with the value passed in for $prob.

The normalize() method iterates over all values previously inserted into the hash, adds them up in $sum, and then divides all the values by the sum. Thus, the new sum of all probability values after a multiplication is again 1. Each value can thus be interpreted as a probability between 0 and 1. At the bottom of the module, prob() finds the value for the searched-for hypothesis by retrieving the hash value using the values() method. The latter has been automatically generated by Moose and returns the value stored under the key of the desired hypothesis.

More Abstraction

If you perform several such tests for various problems, you will identify a pattern: After establishing the hypotheses, the probabilities of all defined hypotheses are always multiplied by the likelihood of newly incoming data. It makes sense (as shown in Think Bayes [3]) to define a class derived from Distrib by the name of HypoTest, much as in Listing 3. The class uses an update() method to update all the values for all hypotheses, based on the probabilities of incoming data.

Listing 3

HypoTest.pm


HypoTest also relies on classes derived from it (e.g., CardHypoTest in Listing 4) to overload the abstract likelihood() method and return the value for P(D|H) based on the probability of the additionally available data D under the assumption that hypothesis H is true.

Listing 4

hypotest


The HypoTest framework in Listing 3 calls the likelihood() method repeatedly to obtain the data probabilities under the assumption of individual hypotheses before storing them in the Distrib distribution. The framework further provides a print() method, which is used to output the values of all the updated probabilities for each hypothesis.

Testing Hypotheses

In Listing 4, likelihood() accepts the letter R from the main program as $data – to record a drawn card with red front as an additional condition. Then, based on the hypothesis also passed in (RR, RB, BB), it computes how likely it is that the test candidate will look at a red surface: 1 (i.e., 100 percent) for RR, 0.5 for RB, and 0 for BB.

For this calculation, the function uses a regular expression that counts the number of Rs in the hypothesis and divides the result by 2 as a floating-point value, so that Perl does not perform integer division and dump the remainder.

Finally, hypotest outputs the probabilities for all hypotheses in the distribution using the print() method from the HypoTest module and correctly reports that the red-red card will appear in 2/3 of all cases:

$ ./hypotest
RC 0.333333333333333
RR: 0.666666666666667
BB 0

In other words, the test candidate, who has just drawn a card with a red front and now turns over this card, will see a red back with probability of 2/3.

Even-Toed Ungulates Stand Back in Amazement

So, even if you tend to faint at the sight of a formula, using the numerical process with a few helper scripts will lead to correct probability calculations for statistical problems that are hard to grasp with intuition alone. If you're interested, you can find more advanced resources (albeit in Python and not Perl) [3] [5] and explore the fascinating world of discrete probability distributions.

Mike Schilli

Mike Schilli works as a software engineer with Yahoo! in Sunnyvale, California. He can be contacted at mailto:mschilli@perlmeister.com. Mike's homepage can be found at http://perlmeister.com.

Infos

  1. Monty Hall problem: http://en.wikipedia.org/wiki/Monty_Hall_problem
  2. Bayes' theorem: http://en.wikipedia.org/wiki/Bayes%27_theorem
  3. Downey, Allen B. Think Bayes. O'Reilly, 2013
  4. Listings for this article: ftp://ftp.linux-magazin.com/pub/listings/magazine/165
  5. "Probabilistic Programming & Bayesian Methods for Hackers" by Cameron Davidson-Pilon: http://camdavidsonpilon.github.io/Probabilistic-Programming-and-Bayesian-Methods-for-Hackers/