Wireless thermo-hygrometer
Comfy Digs

© Lead Image © shamain, 123RF.com
A WiFi sensor monitors indoor humidity and temperature and a Node-RED dashboard reports the results, helping you to maintain a pleasant environment.
MQTT
The acronym MQTT stands for Message Queuing Telemetry Transport. The protocol was developed in 1999 to monitor oil pipelines, but it is still in use today for distributed measurement in the professional sector. Today, the MQTT protocol is increasingly used in the IoT environment, because its low network load and low CPU consumption make it particularly suitable for such applications.
MQTT has three components: a message generator (publisher), a message recipient (subscriber), and a broker that decouples the communication between publisher and subscriber. Therefore, not all components have to be online at the same time to transmit messages.
To ensure that messages are not transmitted in a disorderly manner, MQTT has a tree structure of topics (i.e., message channels that bundle certain types of transmissions). For example, a topic could comprise Building/Floor/Room/Sensor/Temperature. If you want to retain the values of all temperature sensors in a building, you can use wildcards within topics (e.g., Building/+/+/Sensor/Temperature).
MQTT libraries exist for many programming languages. By default, the service runs on TCP port 1883. Further information about the MQTT protocol can be found on the official project website [1].
If you live in a dry climate – or a hot region that requires air conditioning – you might find that your skin starts to feel taut: a good indication that the room air is too dry. Typical thermo-hygrometers can help you monitor humidity and room temperature, but they are usually stationary devices that can only be read when standing right in front of them.
In this article, I build a thermo-hygrometer to keep track of the temperature and humidity in your home. The device connects to a WiFi network and relies on an MQTT server to display its measured values on a Node-RED dashboard. For more information on the MQTT messaging protocol, refer to the "MQTT" box.
Initially, building your own wireless thermo-hygrometer doesn't sound that complicated, but after taking a closer look, you will realize that getting to the finished project involves a large number of individual steps.
MQTT
Like Node-RED, the MQTT server runs on the Raspberry Pi. Information about setting up Node-RED can be found in a previous article [2]. I use Mosquitto as the MQTT server; you can install it, query its status, start it, and stop it with the following:
$ sudo apt update
$ sudo apt upgrade
$ sudo apt install mosquitto mosquitto clients
$ sudo service mosquitto status
$ sudo service mosquitto start
$ sudo service mosquitto stop
To test the server for functionality, open three terminal connections to the Raspberry Pi. In two of them, launch a Mosquitto subscriber for the raspberry topic:
$ mosquitto_sub -h localhost -v -t raspberry
In the third terminal, start a publisher that sends a message for the raspberry topic:
$ mosquitto_pub -h localhost -t raspberry -m "Raspi talks MQTT!"
After sending the message, it appears on the two subscriber terminals. Alternatively, messages can also be sent or received with the MQTTBox Chrome app [3] (Figure 1).
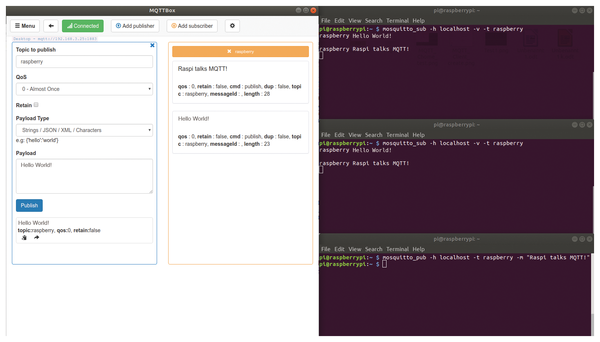 Figure 1: A typical example of an MQTT message transfer with multiple clients.
The Sensor
Figure 2 shows the complete circuit diagram of the sensor. You can solder the components onto a prototype board or plug them into a PCB Prototyping Board [4]. An ESP8266 microcontroller with built-in WiFi is the central component. The calibrated digital AM2321 sensor measures temperature and humidity and is read from the I2C interface. Connect the sensor to the ESP8266 on GPIO4 and GPIO5.
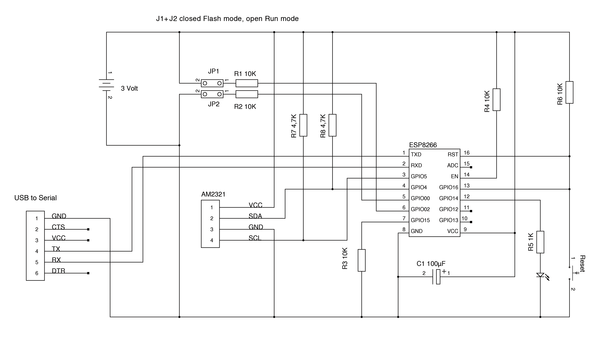 Figure 2: The circuit diagram for the thermal-hygrometer sensor. The heart of the circuit is the AM2321 temperature and humidity sensor and ESP8266 microcontroller.
A USB-to-serial module, which you plug in to the test board from a pin header, is used to program the ESP8266. This setup makes it easy to remove the module to program other sensors. Two 1.5V batteries serve as the power supply; the C1 capacitor in the circuit keeps the operating voltage of the ESP8266 stable.
The LED on GPIO14 is for test purposes. Special attention should be paid to the GPIO16 connection: The internal timer that wakes the ESP8266 from its deep sleep phase so it can transmit the currently measured value depends on this. The R7 and R8 resistors serve as pull-up resistors for the I2C bus. They ensure that the signal levels on the SDA and SCL lines are clean. All other components – four 10K resistors and two jumpers – are needed to program and operate the ESP8266.
As Figure 3 shows, the ESP8266 is soldered to an adapter board that is connected to the base board by a pin header. Some of these adapter boards already come with some of the resistors necessary for operation. Examples of the components needed for the project include:
- ESP8266 and ESP adapter [5]
- USB-to-serial adapter [6] (if not included in your ESP8266 kit)
- AM2321 [7]
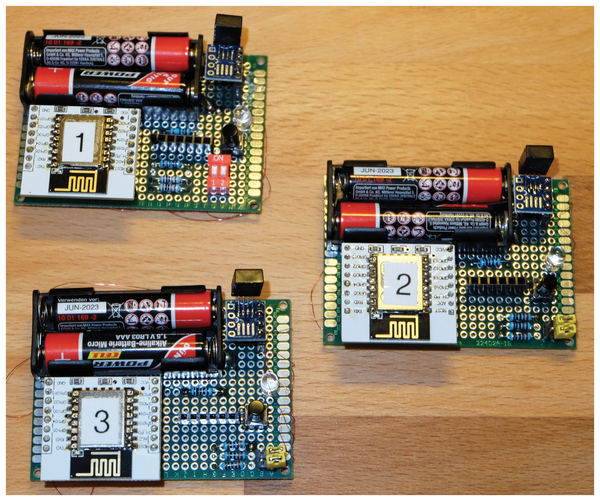 Figure 3: The three completely assembled MQTT sensors transmit the humidity and temperature to the MQTT server wirelessly at one-minute intervals.
Arduino IDE
To write programs for the ESP8266 you need an appropriate development environment. The Arduino IDE, which you can download from the project's homepage [8], is ideal: Just select the appropriate version for your operating system and install it. To start the development environment, change to the installation directory and enter ./arduino on the command line.
Now, you have to adjust the IDE for the ESP8266 by entering the URL http://arduino.esp8266.com/stable/package_esp8266com_index.json in the Additional Boards Manager URLs text box under File | Preferences. The development environment then adds the parameters required for the ESP8266 to the list of board managers.
To install the board manager for the microcontroller, go to Tools | Board: <Board> | Boards Manager, find and select the ESP8266 entry, and click Install. Next, click Tools | Board: <Board> | Generic ESP8266 Module. To upload programs to the ESP8266, you need to connect the USB-to-serial adapter to your computer. Figure 4 shows all the settings needed to upload a program without errors.
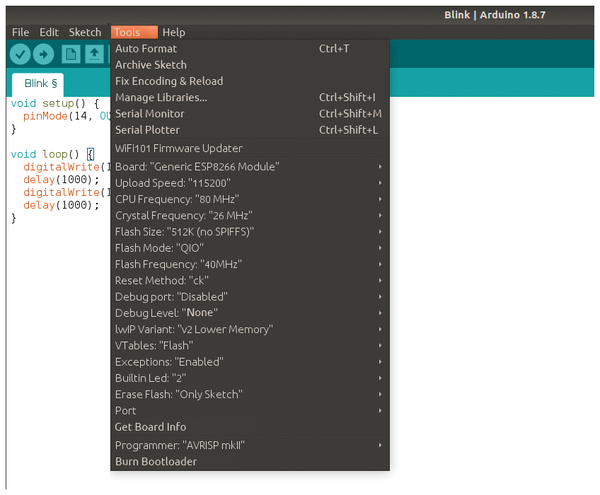 Figure 4: If you use the communication settings shown here in the Arduino IDE, uploading programs to the microcontroller should work smoothly.
Test Program
The test program in Listing 1 [9], which causes the LED on GPIO14 to flash, determines whether programs can be loaded into the ESP8266. To upload and start the program, simply switch the ESP8266 to Flash mode, close the JP1 and JP2 jumpers, and press the reset button. Now click the Upload button (i.e., the icon with the arrow pointing to the right) in the upper left corner of the IDE. The upload will start automatically. If the LED starts flashing, the upload was successful.
Listing 1
Test Program
void setup() {
  pinMode(14, OUTPUT);
}
void loop() {
  digitalWrite(14, HIGH);
  delay(1000);
  digitalWrite(14, LOW);
  delay(1000);
}
If the upload does not work right away, you should check the hardware: Did you solder everything correctly and select the correct boards manager (Generic ESP8266 Module)? Is the transmission speed 115200 (baud)? In many cases, the problem is choosing the wrong port. You always need a TTYUSB port, not a COM port. Remember to remove the two jumpers when the test is finished.
The sensor needs to send its measured values to the MQTT server. To do this, you install a library by clicking Sketch | Include Library | Manage Libraries; then, search for the PubSubClient and install it. Now you can send MQTT messages from ESP8266.
Sensor Program
Listing 2 shows the sensor program. Put simply, the sensor establishes a wireless connection, reads the AM2321, and sends the data to the MQTT server. A closer look reveals many details of the program code.
Listing 2
Sensor Program
01 #include <Wire.h>
02 #include <ESP8266WiFi.h>
03 #include <PubSubClient.h>
04 // WLAN
05 const char* ssid = "<Your SSID>";
06 const char* pass = "<Your WLAN Password>";
07 //MQTT Server
08 const char* serverIp = "<Your MQTT Server>";
09 const char* topic ="/home/sensor2";
10 const int serverPort = 1883;
11 // Energy Save
12 const int interval = 600;//sec
13
14 WiFi client client;
15 PubSubClient mqtt(client);
16
17 void setup() {
18   Wire.begin(4, 5);
19   Serial.begin(115200);
20   Serial.println("\r\n");
21   WiFi.begin(ssid, pass);
22   while (WiFi.status() != WL_CONNECTED) {
23     delay(500);
24     Serial.print(".");
25   }
26   Serial.println(""");
27   Serial.print("Connected: ");
28   Serial.println(ssid);
29   Serial.print("IP address: ");
30   Serial.println(WiFi.localIP());
31   // Measurement
32   Wire.beginTransmission(0x5c);
33   Wire.endTransmission();
34   Wire.beginTransmission(0x5c);
35   Wire.write(0x03);
36   Wire.write(0);
37   Wire.write(4);
38   Wire.endTransmission();
39   delay(3);
40   Wire.requestFrom(0x5c, 8);
41   uint8_t buf[6];
42   for (int i = 0; i < 6; ++i)
43   buf[i] = Wire.read();
44   unsigned short crc = 0;
45   crc = Wire.read(); //CRC LSB
46   crc |= Wire.read() << 8;//CRC MSB
47   unsigned int humidity;
48   signed int temperature;
49   humidity = buf[2] << 8;
50   humidity += buf[3];
51   temperature = buf[4] << 8;
52   temperature += buf[5];
53   if(temperature & 0x8000) temperature = -(temperature & 0x7fff);
54   double temp = temperature;
55   double hum = humidity;
56   temp =temp/10;
57   hum=hum/10;
58   Serial.print("Temperature:");
59   Serial.println(temp);
60   Serial.print("Humidity: ");
61   Serial.println(hum);
62   Serial.print("CRC: ");
63   Serial.println(crc);
64   //JSON
65   char msg[64] =""";
66   sprintf (msg,"{ \"temperature\": \"%-2.2f\", \"humidity\": \"%-2.2f \"\"}",temp,hum);
67   Serial.println(msg);
68   // Connect to MQTT Server
69   mqtt.setServer(serverIp,1883 );
70   while (!mqtt.connected()) {
71     Serial.print("Connecting...");
72     if (!mqtt.connect("Sensor 1")) {
73       Serial.print("failed, rc=");
74       Serial.print(mqtt.state());
75       Serial.println(" retrying in 5 seconds");
76       delay(5000);
77     }
78     Serial.println();
79   }
80   mqtt.loop();
81   mqtt.publish(topic,msg);
82   delay(500); // Wait for MQTT Server
83   Serial.println("goSleep" );
84   ESP.deepSleep(interval*1000000);
85 }
86 void loop()
87 {
88 }
After importing all necessary libraries (lines 1 to 3) the program stores all the required parameters in constants. First is the data for the wireless connection (lines 5 and 6), where you store the appropriate values for your network. Enter the connection data for the MQTT server in the constants that follow (lines 8 to 10).
If you use more than one sensor, they have to send their measured values to different topics; otherwise, they cannot be isolated later. The last parameter (line 12) indicates how long the ESP8266 should sleep after a measurement before starting a new measurement. To conserve the batteries, the microcontroller switches off completely between measurements; the power consumption is then only in the microamp range.
The next two lines (14 and 15) define a connection to the WiFi network and to the MQTT server. Both are client connections. The advantage of MQTT is that the publishers/submitters define which topic they use. The broker provides the topics dynamically, but you have to make sure that the topics match. Because I am working with three sensors in this example, I can simply number them.
After starting a microcontroller, the setup() function always runs first, usually executing just the parts of the program that are required only once. In this case, the function is the complete program because all program parts have to be executed once for a measurement.
The Wire.begin(4, 5) command (line 18) starts an I2C interface on GPIO4 (SDA) and GPIO5 (SCL). The next line initializes the serial output of the program. All messages written here appear on the serial monitor of the Arduino IDE – make sure the monitor uses the same transmission speed as the program (here, 115,200 baud) – which makes it easier to trace bugs in the software and hardware.
The WiFi.begin() command (line 21) establishes and configures a connection to the WiFi network. Because this process takes some time, the following while loop continuously checks the status of the WiFi connection. The loop is only left after the connection has been established. The lines that follow display the connection status on the serial monitor.
Now the actual measurement begins. The first two commands (lines 32 and 33) wake up the AM2321 from energy-saving mode. The next five lines tell it to measure the temperature and humidity, and the delay(3) waits a while before reading the values.
A series of commands follows beginning in line 40 that read the measured values from the I2C bus and store them, formatted in variables. Line 53 is especially interesting; it ensures that even negative numbers are displayed correctly. To transfer the measured values, they are converted to JSON format (lines 65-67), and the string is stored in the msg variable.
Starting in line 69, the software establishes the connection to the MQTT server and transmits the message. Much like connecting to the WiFi network, it tries to establish contact in a loop until communication works. The data transfer is quite unspectacular with the mqtt.publish(topic,msg) command (line 81). The following delay(500) ensures that the ESP8266 does not go into power save mode without transmitting the message completely. If your MQTT server is running very slowly, you might have to increase the wait. The last line, ESP.deepSleep(interval*1000000), in the setup() function puts the ESP8266 back into power save mode.
Now the measurement has been transferred and completed. When the ESP8266 wakes up after the time defined in the interval variable, the program restarts. The loop() function is never called because the program switches the ESP8266 to energy-saving mode at the end of the setup() function. To upload the program to the ESP8266, proceed as described for the test program.
Messages in MQTT
Before you process the messages from the sensors in Node-RED, you first need to check whether they are reaching the MQTT server as expected. To do this, use the MQTT app for Chrome described at the beginning. So that the messages from all three sensors appear in one slide, connect to the /home/+ topic. Now, press the reset buttons on the individual sensors one after the other to send a measured value to the MQTT server. The output of the MQTT app should look like Figure 5. If the sensors provide implausible humidity values, the battery voltage is probably a little too low: The AM2321 sensors require an operating voltage of at least 2.6V.
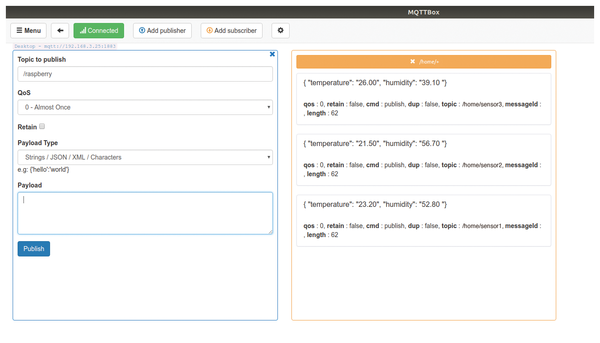 Figure 5: An example of testing the sensors with the corresponding output from the MQTT app.
Final Steps
Now you need to integrate the messages of the MQTT server into the Node-RED flow. You can do this directly via the Node-RED interface. To do so, start the input node by typing mqtt and configure it to receive messages from the topic of one sensor (/home/sensor1). To create the input node, you need to define an MQTT server (Figure 6).
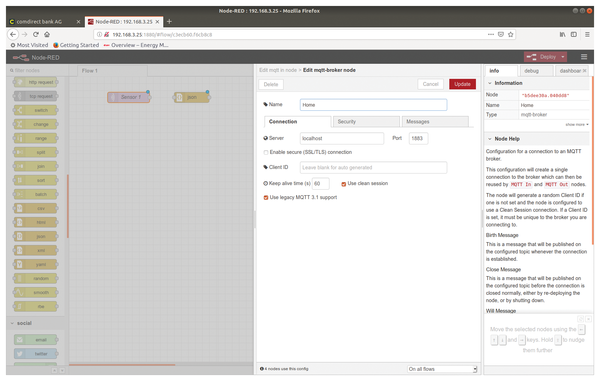 Figure 6: You can define the MQTT input node quite conveniently in the Node-RED interface.
So the Node-RED can process the sensor data, the JSON strings need to be converted to JavaScript objects. Because this type of conversion occurs very often, a JSON node does this by default, allowing you to convert back and forth between JSON strings and JavaScript objects.
Before passing on the JavaScript object to the gauge display instrument, you have to separate the values for humidity and temperature. You can do this by using two change nodes (Figure 7), which you will set up to extract the values for temperature and humidity from the message and pack them into new messages:
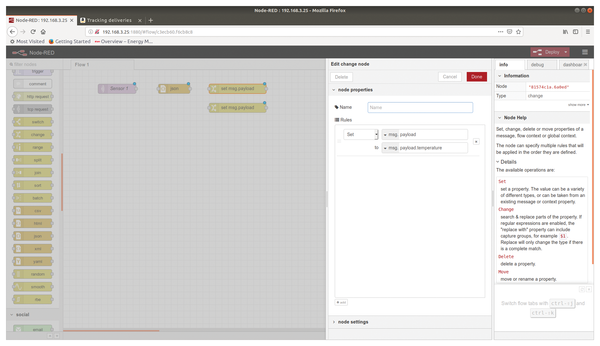 Figure 7: A change node extracts the temperature specification from the JavaScript object.
msg.payload.humidity => msg.payload, msg.payload.temperature => msg.payload
The gauge nodes have to be configured (double-click on the nodes) so that the measured values lie within their display intervals; then, connect the individual nodes (Figure 8). Repeat the described steps for the other two sensors of the encoder trio. Finally, adjust the layout for your dashboard (Figure 9).
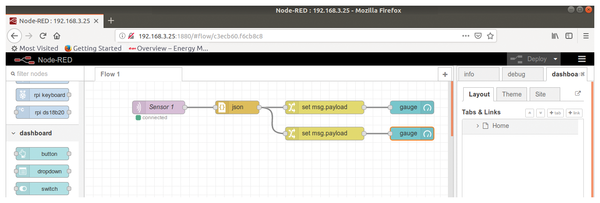 Figure 8: The Node-RED flow for a sensor with one display each for temperature and humidity.
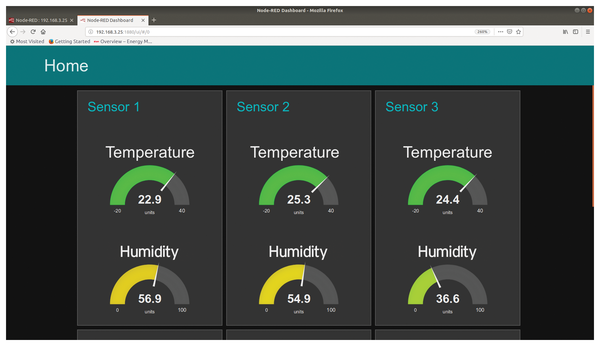 Figure 9: The Node-RED dashboard displays the measured values of the different sensors in an attractive graphic.
Conclusions
The easy-to-use Node-RED tool is ideal for visualizing measured values. Other tasks from the IoT sector can also be implemented easily. When setting up the sensors, you can learn a great deal about the ESP8266 microcontroller, which is also suitable as a basis for your own applications of all kinds.
A small problem remains: The AM2321 works at a level very close to its minimum operating voltage, which is why the measured values are sometimes slightly inaccurate. To solve this problem, you would have to make the power supply of the complete circuit a little more complex by using three batteries and generating the required 3.3V operating voltage with a voltage regulator.
Infos
- MQTT project: https://mqtt.org
- "RaspPi-controlled toy sailboat" by Pete Metcalfe, Linux Magazine, issue 216, November 2018, p. 52, http://www.linuxpromagazine.com/Issues/2018/215/RaspPi-Controlled-Toy-Sailboat
- MQTT app for Chrome: https://chrome.google.com/webstore/detail/mqttbox/kaajoficamnjijhkeomgfljpicifbkaf
- PCB prototyping board: https://www.aliexpress.com/item/32824842884.html
- ESP8266 and breakout board: https://www.sparkfun.com/products/15258
- USB-to-serial: https://www.amazon.com/XCSOURCE-FT232RL-Adapter-Arduino-TE203/dp/B00HSX3CXE
- AM2321: https://www.amazon.com/Quickbuying-Digital-Temperature-Humidity-Replaced/dp/B07H3SSVYL/ref=sr_1_2
- Arduino IDE: https://www.arduino.cc/en/Main/Software
- Code and diagrams for this article: ftp://ftp.linux-magazine.com/pub/listings/linux-magazine.com/226/