System Monitoring with Glances
Watchdog

© Lead Image © Dmitriy Pchelintsev, 123RF.com
Admins and power users like to watch the load on their computers. Glances lets you see immediately if something is wrong.
Linux has no lack of monitoring tools. Because Linux is used so frequently in a server context, monitoring applications have always been important.
For the Linux desktop, you will find many smaller applications that focus on specific areas of monitoring. Glances [1] is a program that keeps you up to date with the current health state of your system.
Glances is available from the software repositories of most popular distributions and derivatives. For Debian, Ubuntu, or Linux Mint, use
sudo apt install glances
to install Glances. The project site [2] lists other ways to obtain Glances, which was written in Python, including Python's own package manager pip, a Glances Docker container, and the option to compile the application from source code.
Modes
Glances supports several operating modes for which you call the ncurses application with different parameters. In the simplest case, simply type the glances command at the prompt. The tool then reads the values from hardware and software, displays them in the terminal ,and continuously updates the process list (Figure 1).
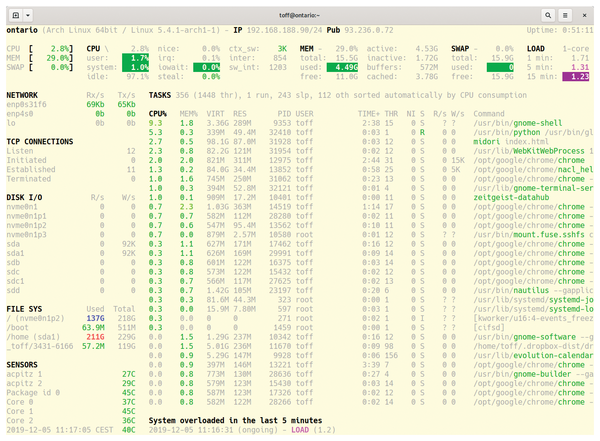 Figure 1: Glances continuously provides a wealth of information about the running system in the terminal.
In order to keep an eye on the server on the home network from anywhere on the LAN, call up Glances on this LAN with the glances -w command. The -w parameter activates browser mode, which does not require its own web server, but is based on the Bottle web framework.
You can now access the program on http://<Server-IP>:61208 in the web browser from any other workstation on the web (Figure 2) and locally via a URL of http://localhost:61208. If you want to monitor the server via SSH from a workstation on the LAN, access the software via the terminal without browser mode.
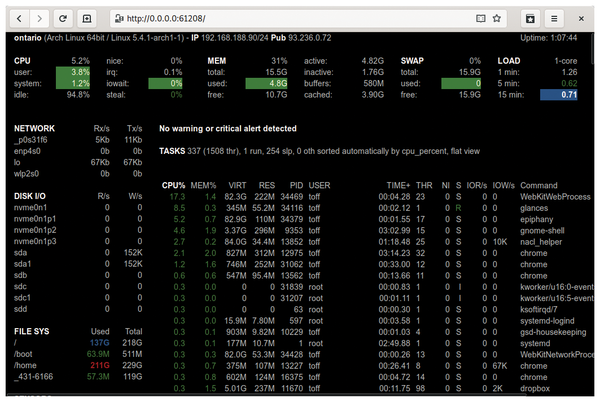 Figure 2: The integrated web server lets you retrieve data in a web browser from somewhere on the network.
In addition, Glances provides a client-server mode, which also allows the server to be called from any workstation on the network. To do this, launch the software on the server with the glances -s command and on the client by entering:
glances -c <Server-IP>
By default, Glances listens on port 61209 in server mode. If required, you can also define another port with the -p parameter.
To prevent unauthorized persons from accessing the Glances server and thus gaining an overview of the available hardware capacities, there is also the option of setting a password on the server with the --password parameter, which the server then prompts you for when you access its IP.
Displays
Glances provides far more information than the usual system monitoring programs. In the upper part of the display, you will find information about the distribution, the kernel used, and the IP address of the system. Below this, you can see information about the CPU, the RAM, and the swap partition, as well as their current load values, listed in a table with several columns.
On the far right, you will also see information about the CPU kernel load and the operating time of the computer. Below that Glances provides periodically updated information about the network interfaces available on the system, the mass storage partitions, the occupancy of the system partition, and the installed sensors.
Shortcuts
Glances supplements these data with corresponding throughput rates, as well as with temperature values for sensors. To the right of this is a process display, which not only lists the individual processes one below the other, but also the CPU and memory usage per process in a separate column to the left. The individual displays are shown graphically, much like the load displays of htop or top.
Glances offers various possibilities to customize the appearance. For example, you can switch certain load displays on or off at the touch of a button. For example, pressing N removes the network interface information from the Glances window, while at the same time moving up the mass storage and I/O data. The developers provide detailed documentation on the keys that can be used interactively in the program [3].
Colors
In general, Glances highlights the utilization values of the hardware with a colored background, where this makes sense. In this way, you as an administrator can see immediately where problems occur. The software uses four colors: Values highlighted in green mean that the utilization of the component concerned is in the low to average range. Blue indicates an already above average load.
If values appear in violet, you should take a closer look at the component in question. Finally, red indicates a clear problem. In this case, software warnings also appear at the bottom of the window. If necessary, you can modify the assignment of the respective load values to the colors in an individual configuration.
Configuration
The Glances configuration file is available in the /etc/glances/ or ~/.config/glances/ folder. Some distributions, such as Arch Linux, don't even create the file, but simply save a template in /usr/share/doc/glances/.
glances.conf is plain text only; you can edit it with any text editor (Figure 3). The configuration file, which is extensive but quite clear-cut, summarizes the individual setting options in groups. Thanks to meaningful naming of the options, even inexperienced users can easily adapt the file to their own wishes.
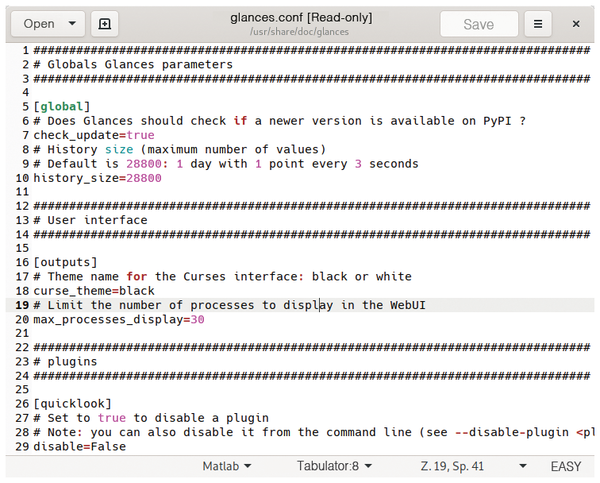 Figure 3: If needed, you can configure even the details of Glances in the glances.conf configuration file.
You can use the *_careful, *_warning, and *_critical variables here to define thresholds for the hardware load's color display. This means that Glances will warn you of even a relatively low load on critical systems, if so desired.
Data Export
Glances lets you export the acquired data for further processing in various formats, including JSON and CSV. To do this, launch the software with the --export parameter and specify the file name and path for the target file.
In some cases, data from Glances can also be transferred directly into databases. To do this, edit the configuration file accordingly to establish a connection to a database server. Detailed examples can be found in the documentation [4].
Conclusions
Glances is ideal for monitoring servers on smaller networks, but also cuts a fine figure on the desktop when it comes to finding system problems. You get a comprehensive list of the individual system states without having to enter many parameters manually or even start different programs.
The software also impresses with its simple configuration options using a text file, which also allows special hardware to be integrated. Also for administrators, who have to document the state of systems, Glances offers valuable help due to its export options to different file and database formats.
Infos
- Glances: https://nicolargo.github.io/glances/
- Installation options: https://glances.readthedocs.io/en/latest/install.html
- Documentation on interactive keys and parameters: https://glances.readthedocs.io/en/latest/cmds.html
- Data export guide: https://glances.readthedocs.io/en/latest/gw/index.html