Getting started with the ELK Stack monitoring solution

Elk Hunting

© Photo by David Santoyo on Unsplash

© Photo by David Santoyo on Unsplash

Author(s):

ELK Stack is a powerful monitoring system known for efficient log management and versatile visualization. This hands-on workshop will help you take your first steps with setting up your own ELK Stack monitoring solution.

Today's networks require a monitoring solution with industrial-strength log management and analytics. One option that has gained popularity in recent years is ELK stack [1]. The free and open source ELK Stack collection is maintained by a company called Elastic. (According to the website, the company has recently changed the name of the project to Elastic Stack, but the previous name is still in common usage.) ELK Stack is not a single tool but a collection of tools (Figure 1). The ELK acronym highlights the importance of the collection's three most important utilities. At the heart of the stack, Elasticsearch collects and maintains data, providing an engine, based on Apache Lucene, for searching through it. Logstash serves as the log processing pipeline, collecting data from a multitude of sources, transforming it, then sending it to a chosen "stash." (Keep in mind that, despite its name, Logstash itself does not preserve any data.) Kibana provides a user-friendly interface for querying and visualizing the data.

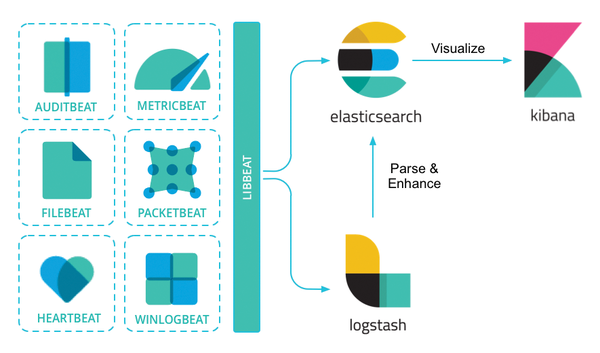
Figure 1: The ELK family and its relatives.

A bundle of tiny apps called beats specialize in collecting data and feeding it to Logstash or Elasticsearch. The beats include:

  • Filebeat – probably the most popular and commonly used member of the beats family. Filebeat is a log shipper that assigns subordinates, called harvesters, for each log to be read and fed into Logstash.
  • Heartbeat – an app that asks a simple question: Are you alive? Then it ships this information and response time to Elasticsearch. In other words it is a more advanced ping.
  • Winlogbeat – is used for monitoring a Windows-based infrastructure. Winlogbeat streams Windows event logs to Elasticsearch and Logstash.
  • Metricbeat – collects metrics from your systems and services. Metrics include CPU and memory disk storage, as well as data for Redis, Nginx, and much more. Metricbeat is a lightweight way to collect system and service data.

The collection also comes with several plugins that enhance functionality for the entire stack.

ELK Stack is popular in today's distributed environments because of its strong support for log management and analytics. Before you roll out a solution as complex and powerful as ELK Stack, though, you'll want to start by trying it out and experimenting with it in a test environment. It is easy to find overviews and short intros to ELK Stack, but it is a little more difficult to study the details. This workshop is a hands-on look at what it takes to get ELK Stack up and running.

ELK Installation

ELK Stack has lots of pieces, so it helps to use an automated deployment and configuration tool for the installation. I will use Ansible in this example. I hope to write this in a simple way that will be easy to follow even if you aren't familiar with Ansible, but see the Ansible project website [2] if you need additional information.

Listing 1 shows an Ansible playbook for installing the ELK Stack base applications. The first few lines define a few settings specific to Ansible itself, such as declaring that the execution will be local (and won't require an SSH network connection). become: true asks Ansible to run all commands with Sudo, which will allow you to run this playbook as a default Vagrant user instead of relogging to root. The tasks section lists the steps that will be executed in the playbook. There are multiple ways to install ELK Stack; Listing 1 uses the yum package manager and specifies a package repository. I specify the exact version numbers for the Elasticsearch, Logstash, and Kibana packages to make it easier to install the correct plugins later.

Listing 1

Ansible Playbook: elk-setup.yml

01 ---
02 - hosts: localhost
03   connection: local
04   gather_facts: false
05   become: true
06   tasks:
07     - name: Add Elasticsearch OpenSource repo
08       yum_repository:
09         name: Elasticsearch-OS
10         baseurl: https://artifacts.elastic.co/packages/oss-7.x/yum
11         description: ELK OpenSource repo
12         gpgcheck: false
13
14     - name: Install ELK stack
15       yum:
16         name: "{{ item }}"
17       loop:
18         - elasticsearch-oss-7.8.0-1
19         - logstash-oss-7.8.0-1
20         - kibana-oss-7.8.0-1

Once the software is installed, you need to run it as a service. You could use systemctl, but Listing 2 carries on using Ansible.

Listing 2

Are Elasticsearch and Kibana Enabled?

01     - name: Start ELK services
02       service:
03         name: "{{ item }}"
04         enabled: true
05         state: started
06       loop:
07         - elasticsearch
08         - kibana

The command in Listing 3 checks to ensure that Elasticsearch is running locally at the default port 9200.

Listing 3

Is Elasticsearch Running?

01 [vagrant@ELK ~]$ curl localhost:9200
02 {
03   "name" : "ELK",
04   "cluster_name" : "elasticsearch",
05   "version" : {
06     "number" : "7.8.0",
07     "minimum_wire_compatibility_version" : "6.8.0",
08     "minimum_index_compatibility_version" : "6.0.0-beta1"
09   },
10   "tagline" : "You Know, for Search"
11 }

Configuring ELK

ELK Stack is set up in a virtual machine and is only listening on localhost, so if you try to open Kibana or Elasticsearch in the host's browser, it won't work. You need to change the network.host setting in the YAML file to 0.0.0.0 to enable network operations.

The Elasticsearch YAML file is usually /etc/elasticsearch/elasticsearch.yml and Kibana and Logstash follow the same pattern. (The YAML config files installed with the RPM packages are quite verbose, though many of the settings are commented out.)

The most important change is to set network.host to 0.0.0.0. Keep in mind that Elasticsearch considers this change as enabling a production environment, therefore ELK Stack will expect a production environment to be running in a cluster. And since I am working in a single-node cluster, I need to set the value discovery.seed_hosts: [] – an empty list, in order to disable cluster discovery features.

The same applies to the Kibana dashboard. You need to modify the value server.hosts to 0.0.0.0 and restart the service.

You can use Ansible to help you get the default config YAML files for Kibana and ES (Listing 4). Store them in the files subdirectory of the playbook directory. Then you can make the required updates and use Ansible to replace the files. You'll need to restart the service if you make changes to the configuration.

Listing 4

elk-setup.yml: Getting the Files

01     - name: Copy file with Elasticsearch config
02       copy:
03         src: files/elasticsearch.yml
04         dest: /etc/elasticsearch/elasticsearch.yml
05         owner: root
06         group: elasticsearch
07         mode: '0660'
08       notify: restart_elasticsearch
09
10     - name: Copy file with Kibana config
11       copy:
12         src: files/kibana.yml
13         dest: /etc/kibana/kibana.yml
14         owner: root
15         group: kibana
16         mode: '0660'
17       notify: restart_kibana
18
19   handlers:
20     - name: Restart Elasticsearch
21       service:
22         name: elasticsearch
23         state: restarted
24       listen: restart_elasticsearch
25
26     - name: Restart Kibana
27       service:
28         name: kibana
29         state: restarted
30       listen: restart_kibana

Listing 4 uses a notify directive to create notifications that will be monitored in the handlers section.

Collecting Data with Beats

Now that the ELK services are up and running, I'll show you how to use Metricbeat and Filebeat to collect data. As I mentioned previously, Metricbeat is designed to collect system and service metrics, and Filebeat collects data from logfiles.

The first step is to set up a dummy Nginx application that will serve as a monitored node (Listing 5).

Listing 5

Provision a Monitored Node

01 ---
02 # ...
03   tasks:
04   - name: Add epel-release repo
05     yum:
06       name: epel-release
07       state: present
08
09   - name: Install Nginx
10     yum:
11       name: nginx
12       state: present
13
14   - name: Insert Index Page
15     template:
16       src: index.html.j2
17       dest: /usr/share/nginx/html/index.html
18
19   - name: Start Nginx
20     service:
21       name: nginx
22       state: started

Most of the tasks in Listing 5 are self-explanatory except the third one, which takes a local file with jinja2 formatting and renders it into the chosen destination format. In this case, I insert a hostname to display it on an HTTP page (Listing 6).

Listing 6

index.html.j2: Minimal HTML File

01 <!doctype html>
02 <html>
03   <head>
04     <title>{{ hostname }} dummy page</title>
05   </head>
06   <body>
07   <h1>Host {{ hostname }}</h1>
08     <p>Welcomes You</p>
09   </body>
10 </html>

I'll use Metricbeat to collect statistics on the monitored node. The YAML file in Listing 7 shows a Metricbeat configuration file that will collect data on the CPU, RAM, disk usage, and a few other metrics.

Listing 7

metricbeat.yml

01 metricbeat.modules:
02 - module: system
03   period: 30s
04   metricsets:
05     - cpu            # CPU usage
06     - load           # CPU load averages
07     - service        # systemd service information
08   # Configure the metric types that are included by these metricsets.
09   cpu.metrics:  ["percentages", "normalized_percentages"]
10 - module: nginx
11   metricsets: ["stubstatus"]
12   period: 10s
13   hosts:
14   - "http://127.0.0.1"
15   server_status_path: "/nginx_status"
16 tags:
17 - slave
18 - test
19 #fields:
20 #  hostname: ${HOSTNAME:?Missing hostname env variable}
21 processors:
22   - fingerprint:
23       fields: ['.*']
24       ignore_missing: true
25 output.elasticsearch.hosts: ["172.22.222.222:9200"]
26 setup.kibana.host: "http://172.22.222.222:5601"
27 setup.dashboards.enabled: true

Metricbeat supports several different modules dedicated to monitoring different services. One of the most commonly used modules is the system module, which collects metrics related to the system. Some of the metrics have individual configuration settings, such as cpu and core, which you can see in lines 21-22.

The Metricbeat config file contains three sections: tags, fields, and processors. The tags section adds new list-type fields. In the fields section, you can append key-value entries to send to JSON.

Beats environment variables behave like environment variables in Bash and take the form ${VAR_NAME}. You can provide a default value to use if no other value is found with ${VAR_NAME:some_default_value}. To enforce the presence of the variable, use ${VAR_NAME:?error message}, in which case Metricbeat will fail to start and log an error message if the environment variable is not found. The most advanced modifiers are in the processors section. Processor settings can dynamically adjust to events, in this case: compute fingerprints from chosen fields. There are many variations of processors that perform tasks such as conditionally adding or removing fields or even executing simple JavaScript snippets that modify our event data.

Another popular module for metrics collection is Nginx, which collects numbers from the Nginx status page. However before you can use the Nginx module, you need to enable the status page for scraping.

Listing 8 shows the section of the nginx.conf configuration file that will enable metrics and configure security so that attempts to reach the status page must come from the host itself. Because the scraper will collect metrics every few seconds, there is no point in logging each entry in access_log, therefore the access_log setting is turned off.

Listing 8

nginx.conf Excerpt

21          location /nginx_status {
22            stub_status on;
23            access_log   off;
24            allow 127.0.0.1;
25            allow ::1;
26            deny all;
27          }

Listing 9 shows the Ansible playbook section that deploys Nginx and Metricbeat.

Listing 9

Deploying Nginx and Metricbeat

01 (...)
02   - name: Copy Nginx config
03     copy:
04       src: nginx.conf
05       dest: /etc/nginx/nginx.conf
06       owner: root
07       group: root
08       mode: '0644'
09     notify: restart_nginx
10
11   - name: Install Beats
12     yum:
13       name: "{{ item }}"
14     loop:
15       - metricbeat-7.8.0-1
16       - filebeat-7.8.0-1
17
18   - name: Start Beats services
19     service:
20       name: "{{ item }}"
21       enabled: true
22       state: started
23     loop:
24       - metricbeat
25       - filebeat
26
27   - name: Copy file with Metricbeat config
28     copy:
29       src: metricbeat.yml
30       dest: /etc/metricbeat/metricbeat.yml
31       owner: root
32       group: root
33       mode: '0644'
34     notify: restart_metricbeat

Log Management

Filebeat attends to tasks related to log collection. Filebeat has some built-in parsers for commonly recognized logfile types, such as syslog, Nginx logs, and a few more.

The filebeat.yml file in Listing 10 shows two modules for handling system logs and Nginx logs. Both modules are built into the base Filebeat application and provide functionality to break the lines of the log into events that can be sent directly to Elasticsearch.

Listing 10

filebeat.yml

01 filebeat.modules:
02 - module: nginx
03   access:
04     var.paths: ["/var/log/nginx/access.log"]
05   error:
06     var.paths: ["/var/log/nginx/error.log"]
07 - module: system
08   syslog:
09     var.paths: ["/var/log/messages"]
10   auth:
11     var.paths: ["/var/log/secure"]
12 setup.kibana.host: "http://172.22.222.222:5601"
13 setup.dashboards.enabled: true
14 output.elasticsearch.hosts: ["172.22.222.222:9200"]

Listing 11 shows an event stored to Elasticsearch by Filebeat (with some insignificant parts removed for brevity). This sample event originates from a log entry like the following:

Sep 28 13:49:07 slave0 sudo[17900]:  vagrant : TTY=pts/1 ;PWD=/home/vagrant ; USER=root ;COMMAND=/bin/vim/etc/filebeat/filebeat.yml

Listing 11

Store in Elasticsearch via Filebeat

01 $ curl -s "localhost:9200/filebeat-7.8.0-2020.09.28/_search?pretty=true&sort=@timestamp&size=1"
02
03 "_source" : {
04   "agent" : {
05     "hostname" : "slave0",
06     "type" : "filebeat"
07   },
08   "process" : {
09     "name" : "sudo",
10     "pid" : 17900
11   },
12   "log" : {
13     "file" : {
14       "path" : "/var/log/secure"
15     }
16   },
17   "fileset" : {
18     "name" : "auth"
19   },
20   "input" : {
21     "type" : "log"
22   },
23   "@timestamp" : "2020-09-28T13:49:07.000Z",
24   "system" : {
25     "auth" : {
26       "sudo" : {
27         "tty" : "pts/1",
28         "pwd" : "/home/vagrant",
29         "user" : "root",
30         "command" : "/bin/vim /etc/filebeat/filebeat.yml"
31       }
32     }
33   },
34   "related" : {
35     "user" : [
36       "vagrant"
37     ]
38   },
39   "service" : {
40     "type" : "system"
41   },
42   "host" : {
43     "hostname" : "slave0"
44   }
45 }

Keep in mind that Filebeat is designed to work with structured and known log types. If you aim to track unspecified logs, you need to use Logstash.

Logstash

In order to track and ship unstructured logs, you have to use a simple log module, and its output should mainly go through Logstash, unless you are only interested in the timestamp and message fields. You need Logstash to act as an aggregator for multiple logging pipelines.

Despite its name, Logstash does not stash any logs. It receives log data and processes it with filters (Figure 2). In this case, processing means transforming, by removing unnecessary elements or splitting objects into terms that can serve as JSON objects and be sent to a tool like Elasticsearch. When the logs are processed, you have to define the output: The output could go to Elasticsearch, a file, a monitoring tool like StatsD, or one of several other output options.

Figure 2: Logstash processing flow.

The logstash.yml file shown in Listing 12 only presents non-default values. You need to define the data and specify where logstash will keep temporary data.

Listing 12

Exceptions from logstash.yml

01 $ cat files/logstash.yml | grep -vP '^#'
02 path.data: /var/lib/logstash
03 pipeline.id: main
04 path.config: "/etc/logstash/conf.d/pipeline.conf"
05 http.host: 0.0.0.0

Pipelines are sets of input/filter/output rules. You can define multiple pipelines and list them in file pipelines.yml. When you have a single pipeline, you can specify it directly in the main config. The pipeline.conf file (Listing 13) lets you specify the input, filter, and output for the pipeline. The input options include reading from a file, listening on port 514 for syslog messages, reading from a Redis server, and processing events sent by beats. A pipeline can also receive input from services such as the Cloudwatch monitoring tool or the RabbitMQ message broker.

Listing 13

pipeline.conf

01 input {
02     beats {
03         port => 5044
04     }
05 }
06 filter {
07     if [fileset][module] == "system" {
08         if [fileset][name] == "auth" {
09 (...)
10   }
11         else if [fileset][name] == "syslog" {
12             grok {
13                 match => {
14        "message" => ["%{SYSLOGTIMESTAMP:[system][syslog][timestamp]} %{SYSLOGHOST:[system][syslog][hostname]} \
15                     %{DATA:[system][syslog][program]}(?:\[%{POSINT:[system][syslog][pid]}\])?: \
16                     %{GREEDYMULTILINE:[system][syslog][message]}"]
17                 }
18                 pattern_definitions => {
19                     "GREEDYMULTILINE" => "(.|\n)*"
20                 }
21             }
22         }
23     }
24     else if [fileset][module] == "nginx" {
25        (...)
26     }
27 }
28 output {
29     elasticsearch {
30         hosts => localhost
31         manage_template => false
32         index => "logstash-%{[@metadata][beat]}-%{[@metadata][version]}-%{+YYYY.MM.dd}"
33     }
34 }

Filters transform data in various ways to prepare it for later storage or processing. Some popular filter options include:

  • grok filter – transforms unstructured lines into structured data.
  • csv – converts csv content into a list of elements.
  • geoip – assigns geographic coordinates to a given IP addresses.

The output settings define where the data goes after filtering, which might be to Elasticsearch, email, a local file, or a database.

As you can see in Listing 13, the sample pipeline starts with waiting for beat input on port 5044. The most complex part of Listing 13 is the filter. In this case, the filter will parse syslog, audit.log, Nginx, and error logs, and each log has different syntax.

Most filters are self-explanatory, but grok [3] requires a comment: it is a plugin that modifies information in one format and immerses it in another (JSON, in this case). To speed up the process, you can use a built in pattern, like IPORHOST or DATA. There are already hundreds of grok patterns available, but you can define your own, like the GREEDYMULTILINE pattern in Listing 13.

A pattern in grok has the format %{SYNTAX:SEMANTIC}, where SYNTAX is a regex (or another SYNTAX with regex) and SEMANTIC is a human-acceptable name that you will want to bind to the matched expression. When transformation is completed, you can output the data, in this case to Elasticsearch.

Kibana and Logtrail

Kibana is a visualization dashboard system that helps you view and analyze data obtained through other ELK components (Figure 3 and 4). Kibana supports hundreds of dashboards, allowing you to visualize different kinds of data in many useful ways. A system of plugins makes it easy to configure Kibana to display different kinds of data.

Figure 3: Kibana dashboard in a browser window.
Figure 4: A Kibana dashboard visualizes Nginx log data obtained from Filebeat.

In this example, I'll show you how to set up Kibana to use Logtrail, a popular plugin for searching and visualizing logfiles.

You have to call kibana-plugin to install Logtrail (Listing 14). (Of course, you also could have installed it with Ansible.)

Listing 14

Installing Logtrail

01 [root@ELK ~]# cd /usr/share/kibana/bin/
02 [root@ELK bin]# ./kibana-plugin --allow-root install \
03 https://github.com/sivasamyk/logtrail/releases/download/v0.1.31/logtrail-7.8.0-0.1.31.zip

The Logtrail config file (Listing 15) lets you define which index/indices it should take data from, as well as some display settings and mappings for essential fields such as the timestamp, hostname, and message. You can also add more fields and define custom message formats.

Listing 15

logtrail.json

01 {
02 "index_patterns" : [
03   {
04     "es": {
05       "default_index": "logstash-*"
06     },
07     "tail_interval_in_seconds": 10,
08     "display_timestamp_format": "MMM DD HH:mm:ss",
09     "fields" : {
10       "mapping" : {
11           "timestamp" : "@timestamp",
12           "hostname" : "agent.hostname",
13           "message": "message"
14       }
15     },
16     "color_mapping" : {
17       "field": "log.file.path",
18       "mapping" : {
19         "/var/log/nginx/access.log": "#00ff00",
20         "/var/log/messages": "#0000ff",
21         "/var/log/secure": "#ff0000"
22       }
23     }
24   }
25 ]
26 }

Security

The last step is to introduce some security to the stack. Until now, if you enabled access to the stack from all networks, it would mean that anyone could mess with the data. The ELK base configuration does not include any kind of access restrictions, but you can add security through plugins. Two options are the paid Elastic X-Pack Security plugin [4] and the OpenDistro [5] security plugin.

It is worth noting that another option would be to use a proxy service like Apache or Nginx to enforce authorization, but for consistency, I'll stick with a dedicated solution.

The basic scenario is, a user presents credentials that are verified against access backends. When the user's identity is confirmed, the security plugin assigns privileges and roles for the user (Figure 5).

Figure 5: Authentication and access with the OpenDistro security plugin.

When the OpenDistro plugin is enabled, Kibana presents a login panel (Figure 6).

Figure 6: Kibana login panel with OpenDistro.

The configuration for the OpenDistro plugin is stored in a few YAML files in /usr/share/elasticsearch/plugins/opendistro_security/securityconfig/.

As you can see in Listing 16, the YAML file for the security plugin is organized by user account. The hash is an encrypted password generated with the hash.sh script, which is located in the tools subdirectory of the plugin directory. The opendistro_security_roles entry lets you specify any of the predefined roles. Most of the roles are self explanatory, but a word is needed for the logstash role, since it also includes permissions to write Beats indices. If you want to create your own roles, you have to modify the action_groups.yml, roles.yml, and roles_mapping.yml file, which are located in the plugin's securityconfig subdirectory. The config file can also refer to roles assigned in an authentication system such as LDAP or ActiveDirectory.

Listing 16

internal_users.yml

01 # All passwords are:
02 # qwerty
03 _meta:
04   type: "internalusers"
05   config_version: 2
06
07 admin:
08   hash: "$2y$12$N5/i8SBuGv9c8vI5fYNWFe2otKwYPbAfBpNObFjCDpRJQp0k55bfC"
09   reserved: true
10   hidden: true
11   opendistro_security_roles:
12   - all_access
13   description: "Demo admin user"
14
15 kibanaserver:
16   hash: "$2y$12$N5/i8SBuGv9c8vI5fYNWFe2otKwYPbAfBpNObFjCDpRJQp0k55bfC"
17   reserved: true
18   hidden: false
19   opendistro_security_roles:
20   - kibana_server
21   description: "Demo kibanaserver user"
22
23 kibana:
24   hash: "$2y$12$N5/i8SBuGv9c8vI5fYNWFe2otKwYPbAfBpNObFjCDpRJQp0k55bfC"
25   reserved: false
26   opendistro_security_roles:
27   - kibana_user
28   - readall_and_monitor
29   description: "Demo kibana user"
30
31 logstash:
32   hash: "$2y$12$N5/i8SBuGv9c8vI5fYNWFe2otKwYPbAfBpNObFjCDpRJQp0k55bfC"
33   reserved: true
34   hidden: false
35   opendistro_security_roles:
36   - logstash
37   description: "Demo Logstash & Beats user"

You can mark a user, role, role mapping, or action group as reserved. Resources that have the reserved flag set to true can't be changed using the REST API or Kibana. Reserved resources are not returned by the REST API and are not visible in Kibana.

In order to further harden your ELK stack, you can generate certificates to use with SSL and enable them in Elasticsearch, then add user credentials to the Kibana server as well as all beats. In the long run, however, it is a good idea to plug your stack into a company authentication service, such as Okta or LDAP.

Summary

ELK is an amazing solution that allows users to swiftly explore the status of the infrastructure. Although it was originally designed to handle logging, with later iterations and plugins, it has become a fully functional MAL tool (Monitoring-Alerting-Logging). This paper has touched on a few of the many potential options. Other notable features include fully configurable alerting, machine learning, anomaly detectors, and a performance analyzer.

The Author

Tomasz Szandala is a PhD student at Wroclaw University of Science and Technology and a Site Reliability Engineer at Vonage in Wroclaw, Poland. When he isn't studying or working his day job, he spends his time learning and improving Ansible, Jenkins, and other open source tools. Because a man cannot live by learning alone, he sometimes enjoys games like World of Warcraft and Civilization.