Visualize your network with Skydive

Bird's-Eye View

© Photo by Michael Olsen on Unsplash

© Photo by Michael Olsen on Unsplash

Author(s):

If you don't speak fluent Ethernet, it sometimes helps to get a graphical view of what your network is doing. Skydive offers visual insights that could reveal complex error patterns.

A picture is worth a thousand words, and sometimes, a visual image of your network can save you hours of troubleshooting. Skydive [1] is an open source network analyzer designed to provide a graphical representation of the IT components and how they interact. I'm not talking about wiring but about the data flows between the nodes. Skydive stores this information in a central location. You can interact with Skydive using a web interface, the command line, or an API.

Skydive consists of a central analyzer and many agents (Figure 1). The agents run on Linux hosts and report network configuration and statistics to the analyzer. The analyzer listens to feedback from its agents and stores the input in a database. Gradually, the analyzer gets to know the entire topology and traffic flows between endpoints. The admin can access the new Skydive instance via the analyzer's web interface.

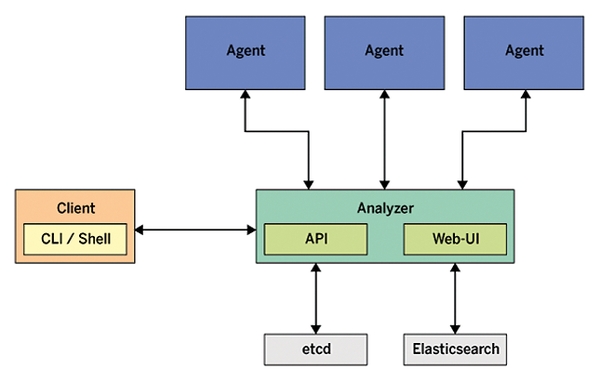
Figure 1: The Linux agents provide states and metrics to the Skydive analyzer.

Agents act as "dumb" data forwarders. The brain of the analyzer is a NoSQL database, either Elasticsearch or OrientDB. Skydive scales horizontally: If an analyzer is at capacity with its agents, additional analyzers can step in and serve additional agents. The analyzers fill the same database with flow information while keeping their configurations in sync using etcd.

Installation

Skydive's Github repository [2] provides a precompiled binary that is ready to use after download. If you don't trust this convenience, grab a build host with a compiler and compile the code yourself (Listing 1).

Listing 1

Building Skydive on CentOS

# yum install go git make protobuf protobuf-c-compiler \
    npm patch libxml2-devel libvirt-devel libpcap-devel \
    protobuf-devel
# mkdir $HOME/go
# export GOPATH=$HOME/go
# export PATH=$GOPATH/bin:$PATH
# mkdir -p $GOPATH/src/github.com/skydive-project
# git clone https://github.com/skydive-project/skydive.git \
    $GOPATH/src/github.com/skydive-project/skydive
# cd $GOPATH/src/github.com/skydive-project/skydive
# make
# make install

The result is an executable file that works as an analyzer or as an agent depending on how it is called. Workable service files for Systemd are provided in the contrib/ directory of the repository. The service retrieves the settings from a configuration file in YAML format, which you will find in etc/ in typical Linux style.

Getting Started

The all-in-one scenario, which runs the agent and analyzer on the same host, is a good choice for getting to know Skydive. After you call skydive allinone, the two components launch immediately and explore the operating system and the network adapters. The analyzer's web interface listens on http://localhost:8082 and lets you browse the new environment without any risks.

The most basic configuration is nothing but a short interlude because the analyzer keeps this data in RAM instead of using persistent storage on the file system. After restarting the software, all the information and settings will be lost. However, Skydive is also capable of storing the explored topology and flow information in an Elasticsearch database. Skydive does not put too much strain on the database server. In simple setups, the database can run on the same host as the analyzer. In either case, Elasticsearch needs to accept the analyzer's connection attempts. No further knowledge of Elasticsearch or NoSQL is needed; Skydive uses the database more like a dumb data silo.

In the sample configuration from Listing 2, the analyzer learns of its new storage facility in a neighboring database system. It is also important to authenticate the web interface because – by default – web access works without a login. The example uses the modest capabilities of Skydive and stores the user accounts in the htpasswd file typical of Apache. For demanding environments, an upstream reverse proxy implements almost arbitrary login scenarios.

Listing 2

Analyzer Using Elasticsearch

analyzer:
  listen: 0.0.0.0:8082
  flow:
    backend: myelasticsearch
  topology:
    backend: myelasticsearch
  auth:
    api:
      backend: mybasic
storage:
  myelasticsearch:
    driver: elasticsearch
    host: 172.31.28.51:9200
    ssl_insecure: true
etcd:
  embedded: true
auth:
  mybasic:
    type: basic
    file: /etc/skydive/skydive.htpasswd

If Firewalld controls network access to the server, the instructions in Listing 3 create an exception for Skydive. With this exception, the analyzer is ready for updates from its agents and the watchful eye of the admin on the web interface.

Listing 3

Firewalld Configuration

# firewall-cmd --permanent --add-port=8082/tcp
# firewall-cmd --reload

Agent

The Skydive agent works like an informer that listens as a regular Linux service on a server, on a virtual machine, or in a container. The configuration file tells the agent which protocols and system areas it needs to monitor and which analyzer is responsible for it.

For its discovery tour, the agent can explore a wide variety of topologies: Open vSwitch, Docker, OpenStack, Linux containers, Libvirt, but also the classic neighborhood protocol LLDP. Libvirt support opens the door for exploring major virtualization platforms such as KVM, Qemu, Xen, and VMware ESXi. From the list of topologies, select the ones you want Skydive to explore.

The configuration file in the repository contains all the directives with examples and default values. By default, the agent uses only Netlink and Netns. The configuration file contains only the specification of the analyzer and is rather short:

analyzers:
  - analyzer.example.net:8082

Once the agent has launched, it disappears into the background and communicates with its analyzer. The relationship is a give-and-take affair. The agent receives work orders and provides information such as a host's profile, IPv4/v6 addresses, network adapter utilization, or the ARP and routing table.

Granted: The same values can also be found using the matching Linux commands. The big advantage Skydive offers is that the details from all the agents are available before troubleshooting starts. The transmitted work instructions ultimately come from the operator in front of the screen and are: collect flows and inject packets.

Collecting Flows

Up to this point, Skydive has not done too much. The colorful topology graph offers a neat overview of the network environment, but it does not really help with problems.

If connections between end devices cannot be established, the network is always the first suspect. Networkers need to immediately find the glitch and solve the problem. This challenge becomes even more complex when the devices involved belong to different teams. Skydive can help, recording traffic flows on the suspicious hosts and listing them in the analyzer. Select the icon of an affected network adapter in the graphical web view and launch the Packet Capture function in the right pane. Just like with Wireshark and Tcpdump, a capture filter can pick out targeted packets that are relevant to the investigation.

Without anyone noticing, the agent collects the flow information of the desired network adapter and sends it to its higher-level controller, which dumps the information in the Elasticsearch database. A look at the Flows column of the analyzer provides the list of all inspected IP connections (Figure 2). The dataset can be sorted or filtered as desired using the flow query. If the flow you are looking for does not appear in the table, the connection request did not reach that host, and the cause of the error must be closer to the source.

Figure 2: The Skydive Agent reports traffic information to the analyzer.

Injecting Packets

Viewing the flow information provides passive insights that do not change the network traffic. The second main task of Skydive is different: forming new packets and injecting them into the network via any agent. In this way, you can check if the test packet arrives at the intended destination.

Assembling a new packet is a convenient point-and-click procedure in Skydive analyzer. In Figure 3, the generated packet simulates a ping between two terminals. Do not type in the required source and destination addresses manually; simply click on the respective network icon in the topology view.

Figure 3: Skydive can generate IP packets and send them to desired targets on the network.

In addition to ICMP, the web UI also supports UDP and TCP packets, in the IPv4 and IPv6 flavors. Skydive does not offer other headers (such as IPsec) or complex constructs. For a penetration test, this would be a poor harvest, but for troubleshooting, these options are quite sufficient.

Speaking of addresses: The Skydive agent sends the packet in exactly the way the analyzer tells it to. If the communication between the two endpoints goes through a default gateway, the destination MAC address in the web interface should be that of the gateway, not the destination system. This quirk does not emanate from Skydive but from the Ethernet protocol.

Once the packet starts its journey, it can no longer be distinguished from a normal packet by the switches and routers it passes through, thus helping with neutral troubleshooting.

Extending the Topology

Admittedly, the Skydive agent will not run on any old device. But zero-access switches and Windows servers will still find a place in the Skydive interface because the topology can be extended to remove the blind spots.

If there is a connection between Server A and Server B that Skydive has not detected, then the Topology rules menu item comes into play. Topology distinguishes between nodes and edges. The terms originate from graph theory and refer to the nodes of a graph and its edges as connecting lines between the nodes. Skydive uses the term node not only for the network nodes, but also for their components. For example, the server node has an edge to the eth0 node, which denotes the server's own network adapter.

A new node needs a name and a type in Skydive. In this case, an unassigned icon appears in the topology view to represent the new node. A new edge needs the identifiers of the two nodes it will connect. Just as with packet capture, the planned endpoints of the edge can be selected by clicking. In addition, each edge needs a user-definable type, such as Layer 2 for an Ethernet connection.

Skydive places no limits on the connections. The edge of eth0 does not need to lead to another network adapter but can also terminate at a block device. Skydive's flexible topology thus provides a basis for documentation and visualization. The command line is better suited for mass extensions, as described in the next section.

Command Line

If you don't want to use point & click for troubleshooting, you can use the command line instead. The Skydive client communicates with the analyzer and presents its results in the console window. You don't need an additional program because the client is integrated into the Skydive binary. Whether the client can talk to its analyzer can be checked by posting a simple status query (Listing 4, Line 1).

Listing 4

CLI Queries

# skydive client status
# skydive client query G
# skydive client query "G.V().Has('Name', 'sd0181')"

If the client and the analyzer are not running on the same server, the client needs the IP address or host name of its counterpart in its command call (use the --analyzer option). In case of successful contact, the display is filled with information about the connected agents, formatted in the JSON format.

When accessing the entire topology tree (Listing 4, second line), Skydive is copious and reports every detail about every edge and node. It makes more sense to use a targeted query that returns only what you want to know. Skydive uses Gremlin as its query language. An example of a query for a specific node is shown in the last line of Listing 4.

A bit of basic knowledge in Gremlin is needed to create connecting lines in the graph at the command line. The subcommand is not query but edge-rule create. Listing 5 creates two nodes, as well as a connecting edge between them.

Listing 5

Creating Nodes and Edges

# skydive client node-rule create --node-name="RT-1" \
  --node-type="host" --action="create"
{
  "Name": "",
  "Description": "",
  "Metadata": {
    "Name": "RT-1",
    "Type": "host"
  },
  "Action": "create",
  "Query": "",
  "UUID": "f2043100-434b-426f-7edc-0382f15d788b"
}
# skydive client node-rule create --node-name="RT-2" \
  --node-type="host" --action="create"
{
  "Name": "",
  "Description": "",
  "Metadata": {
    "Name": "RT-2",
    "Type": "host"
  },
  "Action": "create",
  "Query": "",
  "UUID": "a8b59b62-2da7-4532-4ac6-6f94fc898553"
}
# skydive client edge-rule create \
  --src="G.V().Has('Name', 'RT-1')" \
  --dst="G.V().Has('Name', 'RT-2')" \
  --relationtype="layer2" \
  --metadata="key=value"
{
  "Name": "",
  "Description": "",
  "Src": "G.V().Has('Name', 'RT-1')",
  "Dst": "G.V().Has('Name', 'RT-2')",
  "Metadata": {
    "RelationType": "layer2",
    "key": "value"
  },
  "UUID": "1a429d13-025f-405c-740a-b4bf24bb2763"
}

Under the hood, the Skydive client accesses the Analyzer API. The programming interface is a regular REST API documented in detail via Swagger [2]. Access is not limited to the Skydive client but also works with the usual HTTP clients Curl, Wget, and Httpie. The search for the node in the graph from the previous paragraph is handled using Httpie with a Gremlin query (Listing 6).

Listing 6

Node Search in the Graph

http POST https://skydive.analyzer:8082/api/topology GremlinQuery="G.V().Has('Name', 'sd0181')"

Security

By default, Skydive does not use encrypted communication. Working without encryption might be fine for a small lab scenario, but a serious setup cries out for more protection. Skydive uses X.509 certificates to secure the communication between the analyzer and its agents.

Skydive does not offer the pre-shared keys variant, so you'll need certificates and a certificate authority. Generating a key pair and a certificate involves exactly the same steps as for a web server or OpenVPN. The analyzer learns about its crypto material from a configuration file (Listing 7):

Listing 7

Crypto Configuration

tls:
  ca_cert: /etc/ssl/certs/ca-skydive.crt
  server_cert: /etc/ssl/certs/analyzer.crt
  server_key:  /etc/ssl/certs/analyzer.key
# Agents need these two additional lines:
  client_cert: /etc/ssl/certs/client1.crt
  client_key:  /etc/ssl/certs/client1.key

The Skydive agent receives additional lines that name the client certificate. Every agent always needs its own certificate. However, Skydive does not grumble if the agents happen to share a certificate.

Encryption starts as soon as the participants are kitted out with certificates, the configuration file points to them, and the service is restarted. This also changes web access to the analyzer from HTTP to HTTPS. The add-ons in the next section will now also access the analyzer via TLS and check the server certificate.

If the dataset is in an external database, you should secure access. Elasticsearch has its own certutil tool that takes care of the keys and certificates. On top of that, there is username- and password-based authentication. On the Skydive side, the configuration is extended to include the credentials for the database (Listing 8).

Listing 8

Login Information Configuration

storage: client_cert: /etc/ssl/certs/client1.crt
  client_key:  /etc/ssl/certs/client1.key
  myelasticsearch:
    ssl_insecure: false
    auth:
      username: skydive
      password: uMr8Fv30bX

If several Skydive analyzers need to keep their data in sync and use the key-value database Etcd for this purpose, the analyzers need to have the same level of security. Etcd supports certificates and a user login, but Skydive only uses TLS encryption. Other mechanisms need to replace the missing authentication, for example, Iptables rules or an upstream reverse proxy.

Connected

As an open platform, Skydive can interact with other monitoring systems. For example, the Grafana visualization solution can tap into the collected topology of Skydive via an additional data source and display it graphically on a dashboard. Skydive provides the code for the data source in its Github repository [3]. In order for Grafana to access the desired content, the query needs to use Gremlin syntax. In Figure 4, Grafana fetches the number of concurrent IP connections and displays them in a time-series graph.

Figure 4: Grafana can use Skydive as a data source to display graphs.

Skydive offers plugins for connecting to other monitoring solutions. The list is (still) quite manageable; in addition to Grafana, the only other options are Prometheus and Collectd. Using the Prometheus connector, the Skydive analyzer provides metrics that the Prometheus server collects and processes. With Collectd, this works the other way around: Collectd provides, and the Skydive agent consumes.

If Skydive does not support the monitoring software you are using, there are only two ways to get out of jail: write your own plugin or tap into the API with Curl/Wget.

Outlook

The special feature in Skydive is not the colorful icons in the topology view, which move in a circle across the screen every time you click. The treasure is the connection data that the agents collect in capture mode and report to the analyzer. Skydive can process and analyze this information. The analyzer does not do the work itself but harnesses other tools for this purpose.

The Skydive Flow Matrix add-on prepares IP connections generated by those hosts on which an agent is running. The resulting list contains the protocol, source, destination address, port numbers, and address of the server that accepted the connection. If you find the comma-separated list too boring, you can also admire the data in the form of a Graphviz diagram or Circos ring graph.

Another add-on offers less eye candy but proves useful for security: Security Advisor continuously receives flow information from the analyzer and examines, filters, modifies, and saves the results. The results can be stored on Amazon S3, for example, and analyzed as Flow Logs using AWS methods.

Conclusions

Just as a skydiver admires the beautiful landscape below them, Skydive surveys the network from a bird's-eye perspective. The information comes from the Skydive agents, which collect data on Linux servers and report to a central Skydive analyzer. On the analyzer, admins can retrieve information about the network via the web interface or the command line, examine individual data streams, and even inject packets they define themselves if necessary. The added value of Skydive lies in its holistic approach, which displays the known network components in the form of a graph and visualizes interrelationships.

The Author

Markus Stubbig is a networking engineer who has worked in the IT industry for 16 years. His strong focus is on design and implementation of campus networks around the world.