Graphic display of portfolio stock values

Sketching Curves

© auris, Fotolia

© auris, Fotolia

Author(s):

We'll show you a Perl script that helps you draw area graphs to keep track of your portfolio's performance.

When it comes to wealth management, the performance of a single stock in your portfolio is less important than the overall performance. Although online financial services might give you neat graphs of share price developments for individual stocks, or even a comparison of two values, they do not offer you a tool that lets you monitor the share price development of your complete portfolio at a glance. A Perl script changes this.

Figure 1 shows the configuration file (pofo1.txt) for a portfolio in a text editor. Each line starts with a date in ISO notation followed by the transaction type – a purchase (in) or a sale (out) – of an individual share, the ticker symbol, and the number of shares. The file also can handle cash transactions; instead of the ticker symbol, you see the word cash.

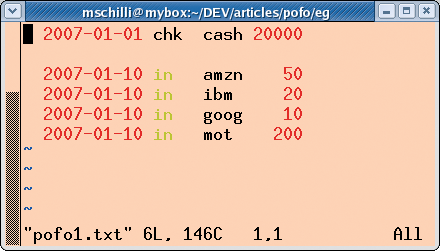
Figure 1: An investor puts a total of US$ 20,000 into their portfolio in January 2007 (line 1) and uses the money to purchase a mix of Internet shares (the following four lines).

To keep portfolio management from becoming a tedious typing session, the script automatically calculates the costs and returns of share transactions at the current rate and modifies the cash balance. The program does not take charges into account, instead, it relies on the user adjusting the balance every now and then manually by using a cash entry and a chk transaction.

The balance of the portfolio in Figure 1 is exactly US$ 20,000 on January 1, 2007. Nine days later, the owner has acquired 50 Amazon shares, 20 IBM shares, 10 Google shares, and 200 Motorola shares at the applicable daily rates. The investor doesn't touch the portfolio for the rest of the year. The graph in Figure 3 shows how these four stocks have developed. While the Amazon and Google shares made considerable gains, Motorola performed poorly, affecting the performance of the portfolio as a whole at year end. All told, the portfolio was up slightly.

Figure 3: The diagram created by the Perl script from the data shown in

Meanwhile, the portfolio owner in Figure 2 invested US$ 20,000 and immediately spent the money on 200 CVS (the drugstore) shares. A week later, the investor bought 150 Amazon shares, which were sold again four months later. In September, the investor predicted a rise in the Google share price and invested in 30 shares.

Figure 2: The investor swaps the items in their portfolio several times a year. Purchases are indicated by an "in" action and sales by an "out" action.

The graph in Figure 4 shows a far higher return and also shows that the stack of share price graphs can cause confusion. The order in which the stocks are shown stays the same, but with some jumps on days in which the portfolio owner buys or sells shares. Also note the pink area at the bottom of the graph that represents the cash balance.

Figure 4: The portfolio owner with the transaction data of

The portfolio graphs for both investors (Figures 3 and 4) were created by the pofo Perl script (Listing 2), which retrieves the buying and selling data of shares from a configuration file.

Later in this article, I will describe how the script works. The input files are shown in Figures 1 and 2. The script expects the configuration file as command-line parameter. Calling pofo pofo1.txt outputs an image file named positions.png with the graphs after a computation that can take up to several minutes if many different stock or long time frames need to be calculated.

Listing 2

pofo


Daily Rates

For each day in the graph, pofo ascertains the individual stocks in the portfolio, retrieves the daily prices, and multiplies them by the number of shares. The RRDtool (Round Robin Database tool) [1], which is designed to visualize network traffic and computer load, stores the daily data and then pours it into an easily readable area graph. It assigns colors to the various stocks/securities from a predefined palette, and draws a legend at the bottom of the graph to explain the assignments.

Historic share prices for all known shares are available online; however, the script would be unbelievably slow if it were to retrieve the figures for each day you ask it to display. Instead, the script uses the CachedQuote module from Listing 1, so the first time you request the price for a share, it retrieves all the prices in a time window starting one year in the past and reaching up to the current day. All values, whether it needs them or not, are stored locally in an SQLite database for subsequent use.

Listing 1

CachedQuote.pm


Speed Boost

When the client requests the next daily share price, CachedQuote simply reads the value from its database repository instead of loading the values over the network. The client does not notice anything, apart from a far faster response to subsequent requests.

If a customer queries a share price on a Sunday, CachedQuote notices that there is no share price for the day in question because stock exchanges do not work on weekends and public holidays. In this case, CachedQuote is intelligent enough to return the last available price instead of a black hole.

Share Price

The CachedQuote.pm module uses the Finance::QuoteHist::Yahoo CPAN module to retrieve the share price data off the web (Listing 1, lines 12, 109-137). The cache retrieves the closing price, which it stores in the $close variable. On receiving a web request, the Yahoo server can return the share price data for a single share for many years. CachedQuote.pm leverages this and sends a request to the server, requesting the data for one year prior to the requested time up to the current day (line 103). If the data is available in the cache, the module does not issue a new request (line 43).

CachedQuote.pm uses the Cache::Historical CPAN module to store and retrieve the share price data. The module has a convenient interface for setting date-based values, set(date, key, value). To retrieve stored values it offers the get(date, key) and get_interpolated(date, key) methods. The key parameter works like the key in a hash. If a share price is missing for a specific day, get_interpolated() retrieves the last available price prior to the given date while get will return the data on a specific date or undef if no data exists for that date.

Lightweight Database

Cache::Historical accesses an SQLite database via the DBD::SQLite CPAN module. SQLite is not under the GPL, but is released under a Public Domain license; the CPAN module includes the source code for the file-based database. SQLite supports requests in SQL syntax but does without a database server, writing the results directly to a local file instead.

CachedQuote.pm sets the SQLite database file to /tmp/cached-quote.dat in line 21. If you prefer not to leave the cache in a dangerous temporary directory, you can change the default when you call the Cache::Historical constructor – for example, new(sqlite_file => "filename").

The quote() function (line 34) first tries to retrieve the stock price with get() (lines 39-41). If this action fails, the get() method returns an undefined value, which is recognized in line 44. Then the module calls quote_refresh() to update the cache for the period before and after the requested date. After this, get_interpolated() should return a useful value.

At the same time, the code decides whether the daily price is unavailable because the stock exchange was closed on the day in question or because the range is not yet cached. If the script discovers that the day was a Sunday, the module should not try to retrieve the latest share prices from the server because there will not be any until Monday.

Therefore, the quote_refresh() function calls since_last_update() in line 65 to check the period since the last cache refresh. This value is stored as a DateTime::Duration object, and delta_days converts this to whole days. If the cache is less than one day old, an update is not performed (lines 69-72, 79-83), and the last available share price (typically from Friday) is then used (interpolation method in line 49).

Date and Time

The CPAN DateTime module interface is so convenient that developers normally do not bother using anything else, but the Finance::QuoteHist::Yahoo module insists on dates in US standard format: mm/dd/yyyy. Thus, the date_format() function in line 140 calls the strftime() method to convert DateTime objects.

The reverse case – converting a mm/dd/yyyy date to a DateTime object – is handled by the dt_parse() function beginning in line 148.

The DateTime::Format::Strptime module defines a new format; the module's parse_datetime() method analyzes a string passed in to it and returns a new object if successful.

To calculate the date one year ago from a DateTime object, all you need to do is call the object's subtract() method with the years => 1 parameter. Of course, this modifies the object itself.

If you need the original value, you first need to copy the contents to a new object with clone() (line 91).

Line by Line

The pofo script (Listing 2) accepts a configuration file, such as pofo1.txt in Figure 1, at the command line. The cfg_read() function starting in line 190 works its way through the lines of the file, each of which describes a share transaction. The function ignores comments starting with a pound sign, # (line 203) and lines that contain nothing but blanks and comments.

Format Conversions

Because the dates are formatted yyyy/mm/dd, pofo has a dt_parse() function (line 226) to define the format and convert the date entries to DateTime objects. As an additional service, the cfg_read() function accepts a reference to the @symbols array, which it populates with all ticker symbols that occur, avoiding duplicates (lines 212-215).

The function returns a reference to the%by_date hash that it populates. The keys in this hash are date values in the form of stringified DateTime objects. The values are each mapped to an array of transactions that have taken place on the same days (line 217). In turn, each transaction comprises an array that contains the fields from the corresponding configuration file line – that is, date, action, ticker symbol, and the number of shares. Cash actions also occur here with cash as their ticker symbol.

To see how many shares of one stock the portfolio holds on a specific day, the script needs to work its way through the transactions that occurred in the portfolio up to this date. Therefore, the for loop starting in line 36 first works its way through all actions before the $start date. The hash keys are dates, which the sort command sorts in ascending order.

The loop calls the pos_add() function for each transaction and puts the results in the %pos hash. The hash assigns a numeric value to each ticker symbol in the portfolio. For shares, this is the number, and for cash, this is simply the sum. The second for loop starting in line 79 then does the same calculation for every single day after the start date, until the current date.

Share acquisitions and sales additionally trigger a movement in the cash item; new shares cost money, and the proceeds from selling shares are credited to the account. On every action, the daily share price is applied; the data is provided by CachedQuote.pm.

RRD Tool Abstract

The area graph for the individual items comes courtesy of RRDtool by Tobias Oetiker [1]. The object-oriented RRDTool::OO CPAN module helps to Perlify and elucidate the unusual syntax of this practical tool.

RRDtool stores data from RRD archives by cumulating the measuring points of one or more data sources. In predefined intervals, the so-called step size, an average is calculated. In line 62 of Listing 2, the pofo program sets the step parameter to 24 hours, telling the RRD database to expect just one update per day. The program assigns a separate data source to each stock (map() call in lines 65-72).

The RRD archive can store up to 5,000 values (line 74) before it starts to overwrite the values in typical RRD style. At a rate of one new value a day, it will take more than 10 years for this to happen. The GAUGE parameter in line 69 stipulates that RRDtool should accept the values directly and not cumulate them; however, RRDtool refuses to accept values for times prior to the last stored daily value; to cope with this, pofo deletes any remaining RRD files in line 55 and the RRDTool::OO constructor quickly recreates them.

Line 16 of Listing 2 defines a freely selectable color palette of RGB values. In lines 46-53, pofo selects a value for each share to be displayed from the @colors array, allowing the viewer to distinguish the stocks in the graph.

The %symbol_colors hash holds the symbol/color palette mappings. The order in which the actions occur in the configuration file defines the display order in the graph.

The for loop starting in line 79 works its way through the days to be displayed in the graph. Each time it does, the if condition in line 83 checks to see whether transactions are available for the current day and, if so, calls pos_add() to add them, thus ensuring that the global hash %pos contains the current portfolio configuration.

The sum_up() function then determines the daily balance of the portfolio and stores the cash values of the individual items in the %parts hash index by the share ticker keys (or cash). After this, the RRD object's update() method passes the hash in to the RRD database, applying the time stamp for the day that has just been processed (line 95). The graph() method finally draws the graph output in the positions.png file and writes the legend at the bottom edge of the image (lines 102-122). The listing shown here only uses six colors for shares, but nothing prevents you from adding new colors to the @colors array in lines 16-18.

In lines 31-34, pofo sets the display period to two years in the past until today. You can change this by modifying the $start and $end variables. If you prefer more information on what is going on during the data processing state, just uncomment line 13; easy_init() then initializes Log4perl, and the output from the DEBUG instructions spread liberally throughout the source code will be directed onto your screen.

The script has no concept of stock splits, in which the historic share price data is changed in retrospect, thus leaving invalid data in the cache. In this case, you would need to delete the cache file, /tmp/cached-quote.dat, thereby removing the whole cash. Filling the file again will not take much effort because web requests to the financial servers efficiently retrieve high volumes of data. Enjoy watching your wealth grow!

The Author

Michael Schilli works as a Software Developer at Yahoo!, Sunnyvale, California. He wrote "Perl Power" for Addison-Wesley and can be contacted at mailto:mschilli@perlmeister.com. His homepage is at http://perlmeister.com.