
Python network data visualization
DNS Data
If you modify the previous code slightly, you can print DNS lookups. Instead of pkt[IP].src, you use pkt.haslayer(DNS). Again, you create an empty list and append to it; then use Scapy to check for DNS and affirm that the packet is a query (with as the QR type) and not a response, which would have a 1 in the QR field. (Listing 4). Again, count and print (Figure 3).
Listing 4
DNS Lookups
01 from scapy.all import *
02 from collections import Counter
03 import plotly
04
05 packets = rdpcap("example.pcap")
06
07 lookups=[]
08 for pkt in packets:
09   if IP in pkt:
10     try:
11       if pkt.haslayer(DNS) and pkt.getlayer(DNS).qr == 0:
12         lookup=(pkt.getlayer(DNS).qd.qname).decode("utf-8")
13         lookups.append(lookup)
14     except:
15       pass
16
17 cnt=Counter()
18 for lookup in lookups:
19   cnt[lookup] += 1
20
21 xData=[]
22 yData=[]
23
24 for lookup, count in cnt.most_common():
25   xData.append(lookup)
26   yData.append(count)
27
28 plotly.offline.plot({
29   "data":[plotly.graph_objs.Bar(x=xData, y=yData)] })
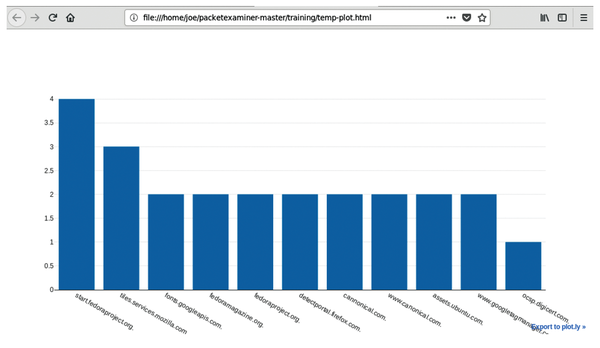 Figure 3: Graph of DNS lookups.
Packets Through Time
At first glance, plotting packets over time is an easy problem to solve. Just grab the packet and use pkt[IP].len; however, if you have a reasonable data collection, you will almost always print data of 1500 bytes (the default MTU in most routers), which produces an uninteresting graph. With the pandas Python data analysis library, you can make human-readable dates from the packets, which are in epoch (unix time) and then bin the date and time. (Listing 5). First, you have to install pandas:
sudo pip3 install pandas
Listing 5
Using the pandas Library
01 from scapy.all import *
02 import plotly
03 from datetime import datetime
04 import pandas as pd
05
06 #Read the packets from file
07 packets = rdpcap('example.pcap')
08
09 #Lists to hold packet info
10 pktBytes=[]
11 pktTimes=[]
12
13 #Read each packet and append to the lists.
14 for pkt in packets:
15   if IP in pkt:
16     try:
17       pktBytes.append(pkt[IP].len)
18
19       #First we need to covert Epoch time to a datetime
20       pktTime=datetime.fromtimestamp(pkt.time)
21       #Then convert to a format we like
22       pktTimes.append(pktTime.strftime("%Y-%m-%d %H:%M:%S.%f"))
23
24     except:
25       pass
26
27 #This converts list to series
28 bytes = pd.Series(pktBytes).astype(int)
29
30 #Convert the timestamp list to a pd date_time
31 times = pd.to_datetime(pd.Series(pktTimes).astype(str), errors='coerce')
32
33 #Create the dataframe
34 df = pd.DataFrame({"Bytes": bytes, "Times":times})
35
36 #set the date from a range to an timestamp
37 df = df.set_index('Times')
38
39 #Create a new dataframe of 2 second sums to pass to plotly
40 df2=df.resample('2S').sum()
41 print(df2)
42
43 #Create the graph
44 plotly.offline.plot({
45   "data":[plotly.graph_objs.Scatter(x=df2.index, y=df2['Bytes'])],
46   "layout":plotly.graph_objs.Layout(title="Bytes over Time ",
47     xaxis=dict(title="Time"),
48     yaxis=dict(title="Bytes"))})
As before, you create lists to hold data (lines 10-11) and, this time, store the length of bytes in a packet and the timestamp of the packet. Next, you will get the length of the packet with (pkt[IP].len) and convert the time using datetime (lines 13-25). With the pandas library, you convert the list to a pandas series and then convert to a timestamp, create the pandas dataframe, and organize the data in to two-second bins (lines 21-41). Now you can use Plotly to print the chart. Lines 46-48 add a title with graph_objs.Layout. The time (x) axis was created during resampling, with the y axis data in bytes (Figure 4).
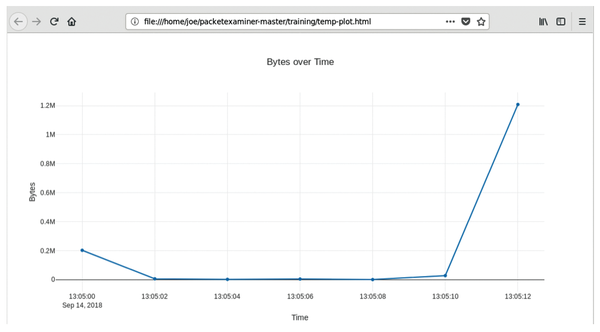 Figure 4: Flow of packets over time.
Conclusion
You can do much more with Scapy, such as grab URLs, pull files from PCAPs, and more; by slightly modifying the examples in this article, you can add more features. The open source PacketExaminer project offers a pre-made harness for PCAP analysis [2], and all of the code in these examples can be found in the training folder of the repo. If you have any questions, just let me know at joe.mcmanus@canonical.com.
Infos
- Scapy: https://scapy.net
- PacketExaminer project on GitHub: https://github.com/joemcmanus/packetexaminer
« Previous 1 2
Buy this article as PDF
(incl. VAT)
Buy Linux Magazine
US / Canada
UK / Australia
Subscribe to our Linux Newsletters
Find Linux and Open Source Jobs
Subscribe to our ADMIN Newsletters
Support Our Work
Linux Magazine content is made possible with support from readers like you. Please consider contributing when you’ve found an article to be beneficial.

News
-
Linux Servers Targeted by Akira Ransomware
A group of bad actors who have already extorted $42 million have their sights set on the Linux platform.
-
TUXEDO Computers Unveils Linux Laptop Featuring AMD Ryzen CPU
This latest release is the first laptop to include the new CPU from Ryzen and Linux preinstalled.
-
XZ Gets the All-Clear
The back door xz vulnerability has been officially reverted for Fedora 40 and versions 38 and 39 were never affected.
-
Canonical Collaborates with Qualcomm on New Venture
This new joint effort is geared toward bringing Ubuntu and Ubuntu Core to Qualcomm-powered devices.
-
Kodi 21.0 Open-Source Entertainment Hub Released
After a year of development, the award-winning Kodi cross-platform, media center software is now available with many new additions and improvements.
-
Linux Usage Increases in Two Key Areas
If market share is your thing, you'll be happy to know that Linux is on the rise in two areas that, if they keep climbing, could have serious meaning for Linux's future.
-
Vulnerability Discovered in xz Libraries
An urgent alert for Fedora 40 has been posted and users should pay attention.
-
Canonical Bumps LTS Support to 12 years
If you're worried that your Ubuntu LTS release won't be supported long enough to last, Canonical has a surprise for you in the form of 12 years of security coverage.
-
Fedora 40 Beta Released Soon
With the official release of Fedora 40 coming in April, it's almost time to download the beta and see what's new.
-
New Pentesting Distribution to Compete with Kali Linux
SnoopGod is now available for your testing needs