Monitor Raspberry Pi with RPi-Monitor

Productivity Sauce
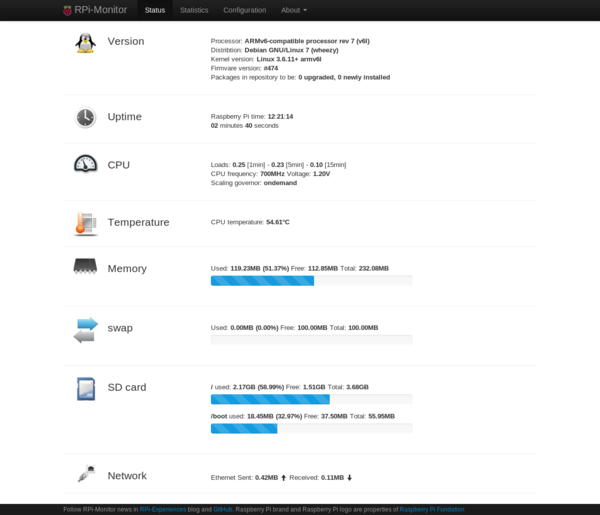
When it comes to keeping an eye on your Raspberry Pi server, you have several tools to choose from, including RPi-Monitor. This simple application can give you a quick overview of the key info, such as CPU load, memory and storage usage, network activity, temperature, and uptime.
RPi-Monitor is distributed as a regular DEB package, and deploying it on Rasberry Pi requires only a few simple steps. First, install the required packages using the following command:
sudo apt-get install librrds-perl libhttp-daemon-perl libhttp-daemon-ssl-perl
Next, grab the latest .deb package from https://github.com/XavierBerger/RPi-Monitor-deb/tree/master/packages and install it using the sudo dpkg -i rpimonitor_x.x-x_all.deb command. Run then the sudo apt-get update && sudo service rpimonitor update command to update RPi-Monitor. Once you've done that, point your browser to http://127.0.0.1:8888 (replace 127.0.0.1 with the actual IP address or domain name of the Raspberry Pi server), hit the Start button, and you should see RPi-Monitor's interface in all its glory.
Besides the basic info in the Status section, RPi-Monitor displays monitored resources as graphs in the Statistics section. The clever part is that you can add custom resources to RPi-Monitor. For example, you can configure RPi-Monitor to monitor the disk usage of an external hard disk and display the collected data as a graph. The Advance usage and customization article provides a description of how to do that, along with a handful of other useful tricks.
comments powered by Disqus