
Graphic display of portfolio stock values
When it comes to wealth management, the performance of a single stock in your portfolio is less important than the overall performance. Although online financial services might give you neat graphs of share price developments for individual stocks, or even a comparison of two values, they do not offer you a tool that lets you monitor the share price development of your complete portfolio at a glance. A Perl script changes this.
Figure 1 shows the configuration file (pofo1.txt) for a portfolio in a text editor. Each line starts with a date in ISO notation followed by the transaction type – a purchase (in) or a sale (out) – of an individual share, the ticker symbol, and the number of shares. The file also can handle cash transactions; instead of the ticker symbol, you see the word cash.
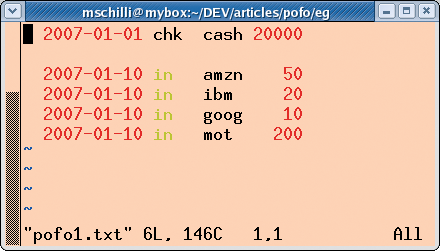 Figure 1: An investor puts a total of US$ 20,000 into their portfolio in January 2007 (line 1) and uses the money to purchase a mix of Internet shares (the following four lines).
[...]
Buy this article as PDF
(incl. VAT)
Buy Linux Magazine
Subscribe to our Linux Newsletters
Find Linux and Open Source Jobs
Subscribe to our ADMIN Newsletters
Digital Autonomy
• The Answer Was Already on the Shelf
• Changing the Chip Industry: How Public Investment Has Grown Open Silicon
• United Nations Open Source Portal Goes Live
• EU Open Source Strategy Plays Key Role in Tech Sovereignty Package
• France Says “Au Revoir” to Microsoft
Support Our Work
Linux Magazine content is made possible with support from readers like you. Please consider contributing when you’ve found an article to be beneficial.

News
-
Yet Another Linux Kernel Vulnerability Discovered
Affecting millions of systems, a kernel flaw discovered by Qualys could allow users to gain root privileges.
-
Ubuntu 26.10 to Include Ubuntu Certified Hardware Check
If you've ever wondered if your laptop or PC is officially certified to run Ubuntu, that curiosity will soon be met.
-
Substantial Update to IPFire Now Available
The lastest version of IPFire features a fundamental change to how the system handles DNS.
-
Gnome Working on Test Center App to Make Testing Easier
It's now possible to test experimental features on the Gnome desktop without worrying that you'll break things.
-
New Vulnerability Discovered in Linux Kernel
Hiding out for nearly 15 years, the Ghostlock vulnerability allows a standard logged-in user to gain root privileges.
-
New Linux Flaw Lets Attackers Escape VMs
A 16-year-old vulnerability allows an attacker to escape a virtual machine, gain access to the host, and execute malicious code.
-
Hannah Montana Linux Is Back!
Developer Noah Cagle decided the world needed the once obscure but beloved Linux distribution and gave it a decidedly pink refresh.
-
System76 Refreshes the Lemur Laptop
If you're looking for a laptop with tons of power and battery, look no further than the latest iteration of the System76 Lemur Pro.
-
More than 43 Million Lines of Code in Linux Kernel 7.2
Using the cloc utility, Michael Larabel of Phoronix discovered that Linux kernel 7.2 has over 43 million lines of code.
-
Kubuntu Focus Goes Ultra
The Kubuntu Focus team has upped the performance ante of its M2 and Zr laptops with the latest, greatest CPUs from Intel.