
Filtering log messages with Splunk
To analyze massive amounts of log data from very different sources, you need a correspondingly powerful tool. It needs to bring together text messages from web and application servers, network routers, and other systems, while also supporting fast indexing and querying.
The commercial Splunk tool [1] has demonstrated its skills in this field even in the data centers of large Internet companies, but the basic version is freely available for home use on standard Linux platforms. After the installation, splunk start launches the daemon and the web interface, where users can configure the system and dispatch queries, as on an Internet search engine (Figure 1).
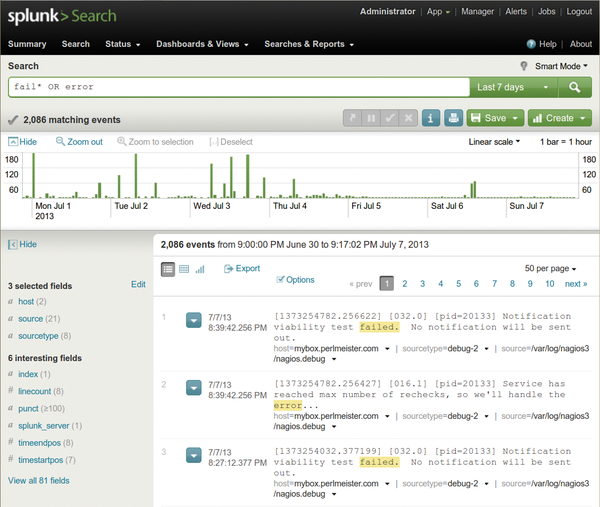 Figure 1: Following a search command, Splunk presents the errors recorded in all real-time-imported logs.
[...]
Buy this article as PDF
(incl. VAT)
Buy Linux Magazine
Subscribe to our Linux Newsletters
Find Linux and Open Source Jobs
Subscribe to our ADMIN Newsletters
Support Our Work
Linux Magazine content is made possible with support from readers like you. Please consider contributing when you’ve found an article to be beneficial.

News
-
Kali Linux Waxes Nostalgic with BackTrack Mode
For those who've used Kali Linux since its inception, the changes with the new release are sure to put a smile on your face.
-
Gnome 50 Smooths Out NVIDIA GPU Issues
Gamers rejoice, your favorite pastime just got better with Gnome 50 and NVIDIA GPUs.
-
System76 Retools Thelio Desktop
The new Thelio Mira has landed with improved performance, repairability, and front-facing ports alongside a high-quality tempered glass facade.
-
Some Linux Distros Skirt Age Verification Laws
After California introduced an age verification law recently, open source operating system developers have had to get creative with how they deal with it.
-
UN Creates Open Source Portal
In a quest to strengthen open source collaboration, the United Nations Office of Information and Communications Technology has created a new portal.
-
Latest Linux Kernel RC Contains Changes Galore
Linux kernel 7.0-rc3 includes more changes than have been made in a single release in recent history.
-
Nitrux 6.0 Now Ready to Rock Your World
The latest iteration of the Debian-based distribution includes all kinds of newness.
-
Linux Foundation Reports that Open Source Delivers Better ROI
In a report that may surprise no one in the Linux community, the Linux Foundation found that businesses are finding a 5X return on investment with open source software.
-
Keep Android Open
Google has announced that, soon, anyone looking to develop Android apps will have to first register centrally with Google.
-
Kernel 7.0 Now in Testing
Linus Torvalds has announced the first Release Candidate (RC) for the 7.x kernel is available for those who want to test it.