
A study in detecting network intruders
Console Shark
The graphical front end of Wireshark is very well suited for offline analysis. If you are dealing with a large volume of data, the graphical display can be very memory intensive. The command-line counterpart, TShark [6], can jump into the breach; it supports the same protocol analyzers as Wireshark. Like tcpdump, TShark can give you command-line output, such as all HTTP packets using the SEARCH request method. Figure 2 shows TShark inspecting a capture file.
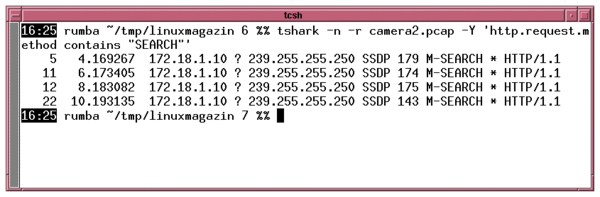 Figure 2: Using a display filter, TShark works its way through a capture file (camera2.pcap).
If the search at the beginning of the analysis is still somewhat imprecise, you can apply the full gamut of standard Linux tools, such as grep, Awk, Perl, or Python, to look for patterns.
There are several ways to filter. The most common option is -Y. If you specify the -e option, TShark will only display selected fields. This means that the output only contains information relevant to the search (for example, the source and destination IP addresses) and does not unnecessarily grow what is potentially already a large haystack.
The -e option also includes the -T option, which defines the output format. A call can then look something like the following:
tshark -T json -e ip.addr -r Capture_File
Thanks to the -T json parameter, TShark outputs structured data in JSON so that further processing software no longer needs a parser but uses the standard library.
Later versions of the malware used DNS to find the C&C server. To do so, the attackers used the local DNS server. This approach gives the admin two options: you can evaluate all DNS traffic, or, if Bind is used as a recursive resolver, you can take a look at the database and see if you come across any suspicious entries.
The rndc dumpdb command creates a dump of all cached entries in the named_dump.db file. The results are stored in the directory defined for the name server below Options | Directory in named.conf. This file contains a large zone file with all the records that the name server knows at this time. You will want to inspect the A records, which are used to associate a domain name with an IP address.
If the attackers are more cunning, you should also use Grep to check whether the local network is requesting unusual record types on the Internet-facing side. The following command returns a simple list of all requested hostnames (but also of other records):
egrep '^[a-zA-Z0-9]' /var/lib/bind/named_dump.db | grep -v PTR | sort | less
Sorting helps with manual analysis. However, a search for the domains is also useful. The following command searches for the cached SOA records:
grep SOA /etc/bind/dns/named_dump.db | awk '{print $2}' | sortUnfortunately, this file does not contain any information about who might have made a suspicious request. But the results of the analysis can be rehashed in TShark to filter the DNS requests for the requester. Since attackers who use DNS names for their C&C servers often limit their validity to a short period of time and repeatedly move their servers, this form of analysis can be useful. But the question is whether DNS is used at all.
NetFlow
An alternative to TShark and tcpdump is to collect NetFlow data. The NetFlow protocol [7] originates from Cisco and sometimes goes by other names (such as JFlow at Juniper). The technology collects connection data and exports the data as a UDP stream to a NetFlow collector, which then processes the results.
Several different versions of the NetFlow protocol exist. Version 9 is standardized in RFC 3954. Many manufacturers support version 9 and the Linux kernel has a kernel module to match. Version 10 of the protocol is also distributed under the name IPFIX.
The exporter sends data via IP connections. The data contains concrete information about which IP address on which source ports communicate with which target IP address on which target port. In addition, the exporter transmits data relating to the numbers of packets sent and the bytes transmitted in each direction.
The NetFlow collector helps with the analysis. The collector is available in a number of different tools, because forensic scientists often have to merge several data sources. The article looks at the NetFlow collector in the ELK stack.
ELK stands for a combination of Elasticsearch, Logstash, and Kibana. The Elastic website [8] describes the simple setup for a single host, where all three ELK components run on one machine. The following call:
bin/logstash --modules netflow --setup -M netflow.var.input.udp.port=port_number
initializes the dashboards in Kibana and also creates some mappings. At the same time, the Logstash call starts with an instance that accepts NetFlow packets on the specified port. Listing 1 shows an addition to the conf.d directory that activates the NetFlow service when Logstash is launched.
Listing 1
Logstash with NetFlow
If Linux gateways are used, you have two ways to produce NetFlow data: Open vSwitch [9] lets you export NetFlow data for each bridge. Alternatively, an ipt_netflow kernel module exports flow data in conjunction with iptables rules. You can either install the package that comes with your distribution or use the Git archive [10]. If you build yourself, you first need to install the packages required for the build.
The kernel module needs information on where to send the data. The call for the install looks like:
modprobe ipt_netflow destination=172.25.1.117:2055,protocol=10
The protocol parameter can be omitted, since version 10 is the default. 2055 is the port number to match the Logstash configuration.
The Linux computer does not start sending data yet. You need iptables rules with a NETFLOW target. In the simplest case, you would issue the following command
iptables -I FORWARD -j NETFLOW
If the rule is more specific, the gateway only forwards certain packets. As a forensics expert, you will want to restrict the search to packets that pass through the gateway, but want to leave the internal network. The task is to find suspicious connections to the outside world.
Network Hardware
Classic network hardware often supports the NetFlow protocol without additional modules, but you may need an additional license for some vendors. With network hardware, however, you should make sure that the typically weak CPU of the management unit is not forced to handle the task of collecting the traffic. A router that serves several 100GBit/s interfaces as a hardware device can quickly be overwhelmed by this traffic.
The sample rate is the key to controlling the balance between data collection and system overload. If tweaking the sample rate does not provide a solution to the performance issues, you would have to set up a mirror port first and install a Linux computer. The installation collects data in the first step, then Kibana (Figure 3) is used to view it. The NetFlow: Conversation Partners and NetFlow: Traffic Analysis dashboards provide an overview.
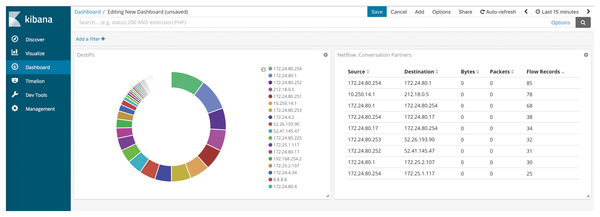 Figure 3: You can adapt the Kibana dashboard to fit your different needs.
When searching for the needle(s) in the haystack, you can now use the Kibana filter function.
Timeline visualizations with the aim of plotting the numbers of packets or bytes from the network that go to various targets over time can help discover conspicuous behavior in normal office operation. Even without a proxy, admins should update during off-peak hours and examine the peaks during off-peak hours. Again, network admins will want to ignore known connections and inspect the remaining traffic (Figure 4).
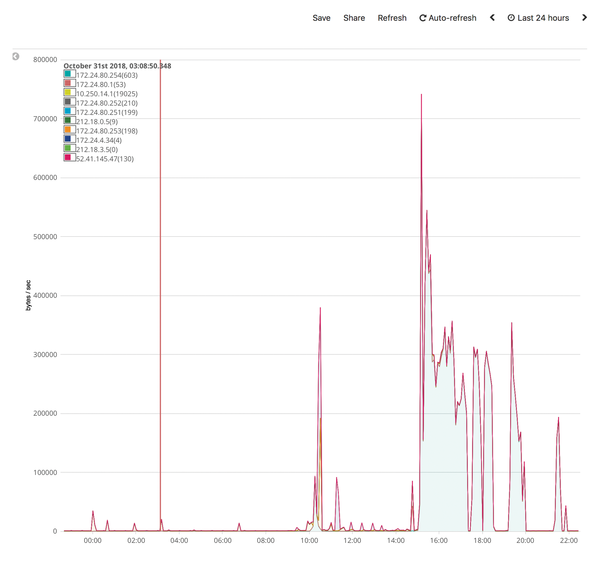 Figure 4: This 24-hour graph lets you drill down to focus on night-time peaks.
Searches that Kibana cannot directly map, such as more complex statistical evaluations, are enabled in the ELK constellation by the Elasticsearch API.
« Previous 1 2 3 Next »
Buy this article as PDF
(incl. VAT)
Buy Linux Magazine
US / Canada
UK / Australia
Subscribe to our Linux Newsletters
Find Linux and Open Source Jobs
Subscribe to our ADMIN Newsletters
Support Our Work
Linux Magazine content is made possible with support from readers like you. Please consider contributing when you’ve found an article to be beneficial.

News
-
So Long Neofetch and Thanks for the Info
Today is a day that every Linux user who enjoys bragging about their system(s) will mourn, as Neofetch has come to an end.
-
Ubuntu 24.04 Comes with a “Flaw"
If you're thinking you might want to upgrade from your current Ubuntu release to the latest, there's something you might want to consider before doing so.
-
Canonical Releases Ubuntu 24.04
After a brief pause because of the XZ vulnerability, Ubuntu 24.04 is now available for install.
-
Linux Servers Targeted by Akira Ransomware
A group of bad actors who have already extorted $42 million have their sights set on the Linux platform.
-
TUXEDO Computers Unveils Linux Laptop Featuring AMD Ryzen CPU
This latest release is the first laptop to include the new CPU from Ryzen and Linux preinstalled.
-
XZ Gets the All-Clear
The back door xz vulnerability has been officially reverted for Fedora 40 and versions 38 and 39 were never affected.
-
Canonical Collaborates with Qualcomm on New Venture
This new joint effort is geared toward bringing Ubuntu and Ubuntu Core to Qualcomm-powered devices.
-
Kodi 21.0 Open-Source Entertainment Hub Released
After a year of development, the award-winning Kodi cross-platform, media center software is now available with many new additions and improvements.
-
Linux Usage Increases in Two Key Areas
If market share is your thing, you'll be happy to know that Linux is on the rise in two areas that, if they keep climbing, could have serious meaning for Linux's future.
-
Vulnerability Discovered in xz Libraries
An urgent alert for Fedora 40 has been posted and users should pay attention.