
Graphic display of portfolio stock values
Sketching Curves

© auris, Fotolia
We'll show you a Perl script that helps you draw area graphs to keep track of your portfolio's performance.
When it comes to wealth management, the performance of a single stock in your portfolio is less important than the overall performance. Although online financial services might give you neat graphs of share price developments for individual stocks, or even a comparison of two values, they do not offer you a tool that lets you monitor the share price development of your complete portfolio at a glance. A Perl script changes this.
Figure 1 shows the configuration file (pofo1.txt) for a portfolio in a text editor. Each line starts with a date in ISO notation followed by the transaction type – a purchase (in) or a sale (out) – of an individual share, the ticker symbol, and the number of shares. The file also can handle cash transactions; instead of the ticker symbol, you see the word cash.
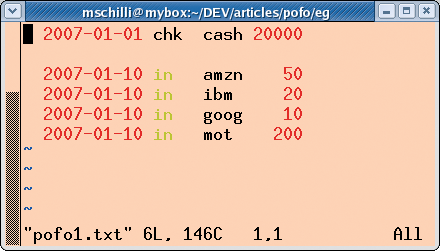 Figure 1: An investor puts a total of US$ 20,000 into their portfolio in January 2007 (line 1) and uses the money to purchase a mix of Internet shares (the following four lines).
To keep portfolio management from becoming a tedious typing session, the script automatically calculates the costs and returns of share transactions at the current rate and modifies the cash balance. The program does not take charges into account, instead, it relies on the user adjusting the balance every now and then manually by using a cash entry and a chk transaction.
The balance of the portfolio in Figure 1 is exactly US$ 20,000 on January 1, 2007. Nine days later, the owner has acquired 50 Amazon shares, 20 IBM shares, 10 Google shares, and 200 Motorola shares at the applicable daily rates. The investor doesn't touch the portfolio for the rest of the year. The graph in Figure 3 shows how these four stocks have developed. While the Amazon and Google shares made considerable gains, Motorola performed poorly, affecting the performance of the portfolio as a whole at year end. All told, the portfolio was up slightly.
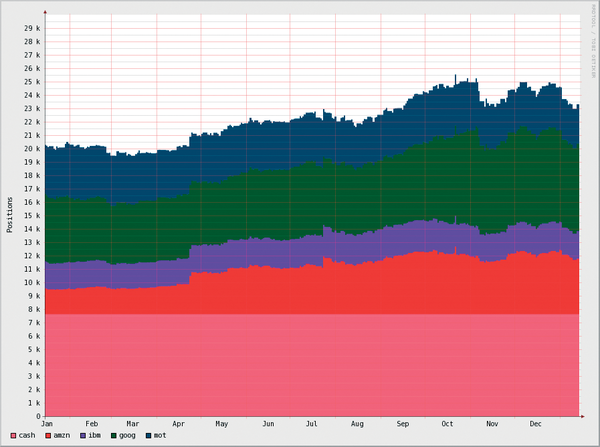 Figure 3: The diagram created by the Perl script from the data shown in
Meanwhile, the portfolio owner in Figure 2 invested US$ 20,000 and immediately spent the money on 200 CVS (the drugstore) shares. A week later, the investor bought 150 Amazon shares, which were sold again four months later. In September, the investor predicted a rise in the Google share price and invested in 30 shares.
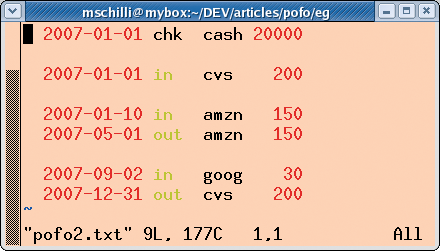 Figure 2: The investor swaps the items in their portfolio several times a year. Purchases are indicated by an "in" action and sales by an "out" action.
The graph in Figure 4 shows a far higher return and also shows that the stack of share price graphs can cause confusion. The order in which the stocks are shown stays the same, but with some jumps on days in which the portfolio owner buys or sells shares. Also note the pink area at the bottom of the graph that represents the cash balance.
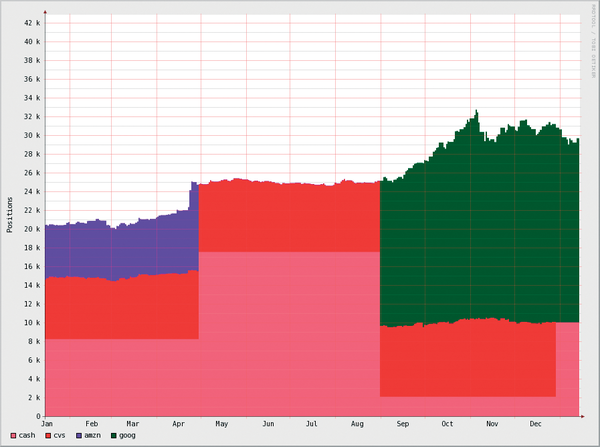 Figure 4: The portfolio owner with the transaction data of
The portfolio graphs for both investors (Figures 3 and 4) were created by the pofo Perl script (Listing 2), which retrieves the buying and selling data of shares from a configuration file.
Later in this article, I will describe how the script works. The input files are shown in Figures 1 and 2. The script expects the configuration file as command-line parameter. Calling pofo pofo1.txt outputs an image file named positions.png with the graphs after a computation that can take up to several minutes if many different stock or long time frames need to be calculated.
Listing 2
pofo
Daily Rates
For each day in the graph, pofo ascertains the individual stocks in the portfolio, retrieves the daily prices, and multiplies them by the number of shares. The RRDtool (Round Robin Database tool) [1], which is designed to visualize network traffic and computer load, stores the daily data and then pours it into an easily readable area graph. It assigns colors to the various stocks/securities from a predefined palette, and draws a legend at the bottom of the graph to explain the assignments.
Historic share prices for all known shares are available online; however, the script would be unbelievably slow if it were to retrieve the figures for each day you ask it to display. Instead, the script uses the CachedQuote module from Listing 1, so the first time you request the price for a share, it retrieves all the prices in a time window starting one year in the past and reaching up to the current day. All values, whether it needs them or not, are stored locally in an SQLite database for subsequent use.
Listing 1
CachedQuote.pm
Speed Boost
When the client requests the next daily share price, CachedQuote simply reads the value from its database repository instead of loading the values over the network. The client does not notice anything, apart from a far faster response to subsequent requests.
If a customer queries a share price on a Sunday, CachedQuote notices that there is no share price for the day in question because stock exchanges do not work on weekends and public holidays. In this case, CachedQuote is intelligent enough to return the last available price instead of a black hole.
Share Price
The CachedQuote.pm module uses the Finance::QuoteHist::Yahoo CPAN module to retrieve the share price data off the web (Listing 1, lines 12, 109-137). The cache retrieves the closing price, which it stores in the $close variable. On receiving a web request, the Yahoo server can return the share price data for a single share for many years. CachedQuote.pm leverages this and sends a request to the server, requesting the data for one year prior to the requested time up to the current day (line 103). If the data is available in the cache, the module does not issue a new request (line 43).
CachedQuote.pm uses the Cache::Historical CPAN module to store and retrieve the share price data. The module has a convenient interface for setting date-based values, set(date, key, value). To retrieve stored values it offers the get(date, key) and get_interpolated(date, key) methods. The key parameter works like the key in a hash. If a share price is missing for a specific day, get_interpolated() retrieves the last available price prior to the given date while get will return the data on a specific date or undef if no data exists for that date.
Buy this article as PDF
(incl. VAT)
Buy Linux Magazine
US / Canada
UK / Australia
Subscribe to our Linux Newsletters
Find Linux and Open Source Jobs
Subscribe to our ADMIN Newsletters
Support Our Work
Linux Magazine content is made possible with support from readers like you. Please consider contributing when you’ve found an article to be beneficial.

News
-
Canonical Releases Ubuntu 24.04
After a brief pause because of the XZ vulnerability, Ubuntu 24.04 is now available for install.
-
Linux Servers Targeted by Akira Ransomware
A group of bad actors who have already extorted $42 million have their sights set on the Linux platform.
-
TUXEDO Computers Unveils Linux Laptop Featuring AMD Ryzen CPU
This latest release is the first laptop to include the new CPU from Ryzen and Linux preinstalled.
-
XZ Gets the All-Clear
The back door xz vulnerability has been officially reverted for Fedora 40 and versions 38 and 39 were never affected.
-
Canonical Collaborates with Qualcomm on New Venture
This new joint effort is geared toward bringing Ubuntu and Ubuntu Core to Qualcomm-powered devices.
-
Kodi 21.0 Open-Source Entertainment Hub Released
After a year of development, the award-winning Kodi cross-platform, media center software is now available with many new additions and improvements.
-
Linux Usage Increases in Two Key Areas
If market share is your thing, you'll be happy to know that Linux is on the rise in two areas that, if they keep climbing, could have serious meaning for Linux's future.
-
Vulnerability Discovered in xz Libraries
An urgent alert for Fedora 40 has been posted and users should pay attention.
-
Canonical Bumps LTS Support to 12 years
If you're worried that your Ubuntu LTS release won't be supported long enough to last, Canonical has a surprise for you in the form of 12 years of security coverage.
-
Fedora 40 Beta Released Soon
With the official release of Fedora 40 coming in April, it's almost time to download the beta and see what's new.