Maps with uMap

DIY Maps

© Lead Image © Matttilda, fotolia.com

© Lead Image © Matttilda, fotolia.com

Article from Issue 200/2017
Author(s):

uMap provides an easy way to create advanced maps based on the OpenStreetMap service. This article explains how to put uMap's features and functionality to practical use.

Thanks to its open nature, OpenStreetMap spurred a large number of genuinely useful applications that piggy-back on this excellent map project. uMap [1] is a case in point: This web-based application allows you to create multi-layered maps complete with markers, lines, and polygons (Figure 1).

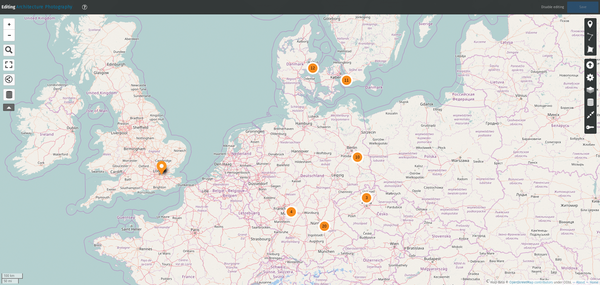
Figure 1: uMap allows you to build advanced dynamic maps in no time.

uMap software is released under an open source license, and the project's website provides instructions on how to deploy a uMap instance on your own server. This is not a trivial task, though. So, it probably makes sense to start with a hosted service. You can choose from several hosted uMap installations, including the one maintained by uMap developers at umap.openstreetmap.fr. Although you can use the service anonymously, it's worth creating an account, because this allows you to save and manage your maps. uMap supports several popular sign-in providers, including GitHub, Bitbucket, Twitter, and, of course, OpenStreetMap. Once you've signed in, click the Create a map button to generate a map.

All tools in the map editor are grouped into two panels. You'll find the navigation and sharing functions in the left panel, while the right panel holds all editing tools. The first order of business is to give the map a descriptive name and save the map. To do this, click the Edit map settings button (it looks like a cog) in the right panel and enter the desired name and short description in the appropriate fields. While you are at it, you might want to adjust a few other settings. The User interface options section, for example, lets you customize the navigation panel by toggling zoom, search, measure, and other buttons.

Although you can leave most of the settings in other sections at their default values, there are at least two options you might want to adjust. In the Default properties section, you can specify the default zoom level, whereas the Limit bounds section lets you limit the map to a specific area (Figure 2). You can specify the desired limits manually or let uMap do the heavy lifting. Locate the desired area and click the Use current bounds button to populate the fields with the actual geographical coordinates. If you want to delete, clone, or reset the current map, you can do this with the appropriate buttons in the Advanced options section. Once you are satisfied with the settings, click Save to save the map.

Figure 2: Modifying map properties.

Next step is to configure permissions. By default, only the owner (you) has editing rights, and the map is available for public viewing. To change this, press the Update permission and editors button (it looks like a key) in the right panel, and then configure the permissions to your liking.

Look at the map, and you'll immediately notice that it's in French. Fortunately, you can easily switch to an English-based OpenStreetMap. In fact, uMap supports different map styles (or tile layers), including OSM monochrome, OSM Lyrk, OSM OpenCycleMap, and many others (Figure 3). To switch to a different map style, click the Change tilelayers button in the right panel and choose the desired layer. Remember to save the changes.

Figure 3: uMap supports various map styles.

Once the map is ready, you can start populating it with markers (Figure 4). To add a marker, click the Draw a marker button in the right panel, and then click on the desired location. This places a marker and opens the marker properties' right sidebar. Here, you can give the marker a name and a short description. To change the marker's default shape and color, expand the shape properties section, and then use the Color and Icon symbol options to specify the desired color and marker shape. You can also assign a symbol to the marker using the Icon symbol option. Adding lines and polygons is equally easy. Use the appropriate buttons in the right panel to pick the desired tool, draw a line or a shape, and then use the properties sidebar to modify the available settings.

Figure 4: Adding a marker to the map.

uMap allows you to add multiple layers to a map (Figure 5). This functionality can come in handy in many situations. For example, if you plan a trip that goes to several countries, you can create a separate layer for each destination. You can then show and hide various layers as needed. To work with layers, click the Manage layers button in the right panel. This opens a sidebar with the list of existing layers. You can use buttons next to each layer to toggle its visibility, edit properties, and view data. To add a layer, click Add a layer and give the new layer a name and description. If desired, change the layer type by selecting the appropriate entry from the Type of layer drop-down list.

Figure 5: uMap allows you to add multiple layers to a map.

Besides the default type that shows individual markers on the map, uMap supports the Clustered and Heatmap types. The former displays map markers as expandable circles, and counters inside them indicate the number of elements in each cluster. And, as the name suggests, the Heatmap type displays data of the map as a heat map. To distinguish between different layers, you might want to specify the marker color and shape for the entire layer in the Shape properties section.

Exporting Layer Data

After you've spent hours pouring data into your map, you'd probably want to back up the final result. Although the application doesn't provide a straightforward way to create a backup file, you can use a relatively simple workaround. Take the URL of your map and remove the name of the maps from it, leaving the map's key. For example, if the map's full URL is http://umap.openstreetmap.fr/en/map/my-map_133151, the sanitized URL is http://umap.openstreetmap.fr/en/map/133151. Now, append /geojson to the URL: http://umap.openstreetmap.fr/en/map/133151/geojson. Point your browser to this URL to get map data in the GeoJSON format. Next, use the browser's search feature to find the name of the layer you want to back up. Note the ID number of the layer and point the browser to http://umap.openstreetmap.fr/en/datalayer/ID/ (replace ID with the actual id number of the layer). This returns the layer data in the GeoJSON format. Then, copy the data, paste it into a text file, and save it.

Building Dynamic Maps

Although uMap makes it easy to populate a map with markers, doing this manually can still be a rather laborious process – especially if you already have basic geographical data in a spreadsheet or a text file. Fortunately, the application also offers advanced features that let you create maps that pull data from a remote source (Figure 6).

Figure 6: Linking a map layer to a remote data source.

Suppose you want to build a map of all interesting locations you want to photograph during your next trip. Instead of adding them directly to the map, you can create a comma-separated text file containing location data and link it to the map. First, you need to create a text file and publish it on the web. There are several ways to do that, but the easiest one is probably to create a public snippet on GitLab or a gist on GitHub. The snippet should contain the header in a list of entries as follows:

lat,lon,description
50.109,8.669,Short description goes here.

Once you've added the desired entries, save the snippet. To get the snippet's raw content, append /raw to the snippet's URL, for example: https://gitlab.com/snippets/1771159/raw. Copy this direct URL and switch to uMap. Here, you need to configure a layer to pull data from the snippet. To do this, click the Manage layers button, click Edit next to the desired layer, and expand the Remote data section. Paste the direct URL of the snippet into the Url field and select csv from the Format drop-down list. Enable the Dynamic and Proxy request options, and then save and reload the map. You should see map markers for each entry in the snippet. If you click on a marker, you'll see an empty pop-up. If you would like the pop-up to display something useful, uMap's got you covered.

Suppose you want the makers in a specific layer to display the content of the description field in the snippet. For this, you need to modify the default pop-up template. In the Layer properties sidebar, expand the Interactive options section. In the Popup content template field, add the {description} placeholder. Note that the name of the placeholder must match the name of the field in the snippet. Save and reload the map, click on a marker, and you should see the content of the description field in the pop-up.

uMap has a few other clever tricks up its sleeve. The application supports basic Markdown options, so you can add text formatting to the descriptions directly in the snippet. It's also supremely easy to add photos to pop-ups (See the "From Mejiro to uMap" box for more information.) Add the url column to the snippet and links to photos for each entry:

lat,lon,description,url
50.109,8.669,Short description goes here.,http://url/foo.jpg

In the Popup content template field, add the {{{url}}} placeholder. The extra curly brackets instruct uMap to render the URL as an image. Save and reload the map, click on a marker, and you should see the specified photo in the pop-up (Figure 7).

Figure 7: You can add descriptions, links, and images to a pop-up.

From Mejiro to uMap

The ability to pull data from external sources opens a whole new world of possibilities. I use my own Mejiro PHP-based web application [2] to publish photos. It can be used to show the location of each geotagged photo on OpenStreetMap, but I wanted to display all photos in Mejiro on uMap. So I wrote a quick-and-dirty PHP script that generates a comma-separated output containing latitude and longitude values along with links to thumbnails. I put the script in the Mejiro directory on the server. Then, I created a dedicated layer in a uMap map and linked the layer to the script. You can see the result in Figure 8. The script is available on GitLab [3], and it can be easily adapted to work with other photo sharing applications that store photos and thumbnails in dedicated directories.

Figure 8: Map that pulls data and thumbnails directly from Mejiro.

Conclusion

When it comes to creating maps with a minimum of effort, uMap is hard to beat. Not only does it allow you to create maps in a matter of minutes, the application also provides advanced functionality that can be used to create multiple layers, link them to remote data sources, and configure marker pop-ups to show all sorts of useful information. You can also publish and share finished maps with others, as well as embed maps in web pages. In short, if you are looking for a powerful yet easy-to-use mapping tool, uMap is just the ticket.

Buy this article as PDF

Express-Checkout as PDF
Price $2.95
(incl. VAT)

Buy Linux Magazine

SINGLE ISSUES
 
SUBSCRIPTIONS
 
TABLET & SMARTPHONE APPS
Get it on Google Play

US / Canada

Get it on Google Play

UK / Australia

Related content

comments powered by Disqus
Subscribe to our Linux Newsletters
Find Linux and Open Source Jobs
Subscribe to our ADMIN Newsletters

Support Our Work

Linux Magazine content is made possible with support from readers like you. Please consider contributing when you’ve found an article to be beneficial.

Learn More

News