
Network monitoring from the cloud
Dashboard Tour
Now that you've installed the agents on multiple computers and can access them from the Cloud dashboard, it's time to familiarize yourself with the dashboard.
Netdata collects monitoring data from dozens of hardware and software components, such as CPU, memory, disks, networking, filesystems, and more. What makes it even more useful though is that Netdata can also collect metrics from hundreds of popular services and applications.
Netdata deploys collectors to gather the metrics. It includes collectors for collating performance data from some of the popular services and apps, such as Apache, NGINX, Tomcat, MySQL, Postgres, MongoDB, Ceph, OpenLDAP, Tor, Docker, and more [5].
All the collected metrics are exposed via the Netdata dashboard as interactive charts. Netdata shows all its charts on a single scrollable page. You can also navigate between the various elements using the menu placed on the dashboard's right-hand side. Note, however, that if you run Netdata on multiple computers that run different operating systems or different versions, the menus might look a little different for each one.
Using the mouse, you can drag the charts to the left or right to move forward and backward through the different time intervals. Similarly, you can change the time markers by holding down the Shift key as you scroll within a chart. To reset a chart to its default view, simply double click inside it.
The good thing about Netdata's visualization is that when you change the view on one chart, it automatically replicates the same view on the other charts as well. Thanks to this feature, you'll always get a synchronized view of the metrics.
The charts themselves are self-explanatory. At the top, you get an overview of the computer's resources. This is followed by a summary of the computer's CPUs, including their utilization and information about the interrupts handled by each, in addition to other aspects. Similarly, you get real-time information about the system's memory utilization, and so on (Figure 4).
 Figure 4: In addition to the built-in collectors, you can pull in additional ones via plugins.
Most of the charts have a brief description to explain the feature they display along with its importance. Unless you're well-versed with monitoring Linux/BSD systems, you should spend some time exploring the individual metrics and how they can be used to monitor your systems' health.
Get Alerts
In addition to the active performance monitoring, the Netdata Agent can also help you ensure your systems and applications are healthy by alerting you about possible issues. The Netdata Agent includes dozens of preconfigured alarms that trigger alerts when a monitoring component requires your attention.
As mentioned earlier, these alarms are preconfigured with sensible defaults. Just like Netdata itself, these alarms have been designed by the tool's system administrator community, which means the alarms will be activated automatically upon the agent's installation. That said, while you don't need to edit them, the alarms can be customized to meet your needs.
You can access Netdata's alarm notifications system by clicking the alarms button (the bell icon) at the top of the dashboard. This will bring up a screen that shows the currently raised alarms, along with tabs to view all running alarms, as well as the alarms log (Figure 5).
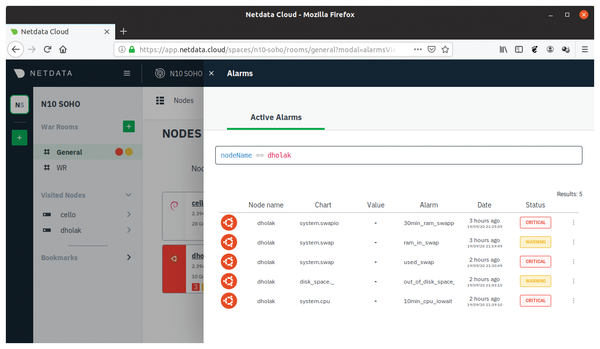 Figure 5: You can view details about the raised alarms, as well as go to the chart where the alarms were raised for further analysis.
To tune a default alarm, switch to the All tab. This page will list the various alarms along with their preconfigured settings. The source row in the tab points to the configuration file that controls the settings for a particular alarm (Figure 6). You'll need to edit the file and adjust the settings as per your requirements.
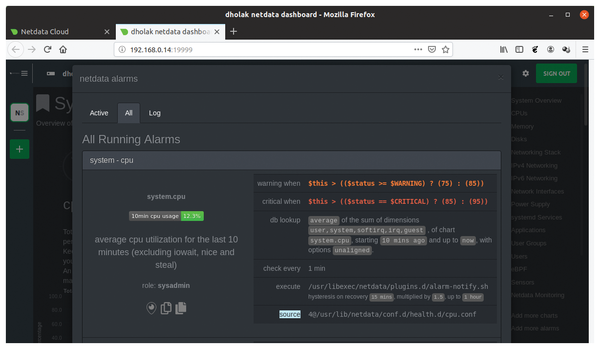 Figure 6: Below every alarm's name is a badge that updates automatically to show the chart's current value.
For instance, the /usr/lib/netdata/conf.d/health.d/ram.conf file controls the alarms related to a computer's physical RAM. By default, Netdata will warn you when the amount of used RAM crosses the 80 percent threshhold. You can change this behavior by editing the value in the warn line.
After you've saved the file, you can reload the health monitoring settings with:
$ sudo netdatacli reload-health
See the project's documentation on the health monitoring system [6] to understand the other lines in an alarm's configuration file.
Going Further
Once you've become accustomed to Netdata, it's time to explore the various settings and configure it to meet your requirements. The project has excellent documentation (as referenced throughout the article).
While I've covered most of Netadata's basic features, there's a lot more you can do with it. You can, for instance, export and import snapshots [7] of your dashboard's contents, which helps diagnose major errors and anomalies. You can also create custom dashboards that do a better job of visualizing the metrics in which you are interested.
Despite server monitoring being an already crowded space, Netdata has managed to create a wide berth for itself thanks to its ease of use and customizability. No wonder then that it is one of the most starred projects in the Cloud Native Computing Foundation landscape.
Infos
- Netdata: https://netdata.cloud
- Installation options: https://learn.netdata.cloud/docs/agent/packaging/installer#have-a-different-operating-system-or-want-to-try-another-method
- Netdata client inside Docker: https://github.com/netdata/netdata/blob/master/packaging/docker/README.md
- Spaces and War Room: https://learn.netdata.cloud/docs/cloud/organize
- Netdata collectors: https://learn.netdata.cloud/docs/agent/collectors/collectors
- Health monitoring system: https://learn.netdata.cloud/docs/agent/health
- Exporting/Importing snapshots: https://learn.netdata.cloud/guides/step-by-step/step-07#export-and-import-a-snapshot
The Author

Mayank Sharma has been writing and reporting on open source software from all over the globe for almost two decades.
« Previous 1 2
Buy this article as PDF
(incl. VAT)
Buy Linux Magazine
US / Canada
UK / Australia
Subscribe to our Linux Newsletters
Find Linux and Open Source Jobs
Subscribe to our ADMIN Newsletters
Support Our Work
Linux Magazine content is made possible with support from readers like you. Please consider contributing when you’ve found an article to be beneficial.

News
-
So Long Neofetch and Thanks for the Info
Today is a day that every Linux user who enjoys bragging about their system(s) will mourn, as Neofetch has come to an end.
-
Ubuntu 24.04 Comes with a “Flaw"
If you're thinking you might want to upgrade from your current Ubuntu release to the latest, there's something you might want to consider before doing so.
-
Canonical Releases Ubuntu 24.04
After a brief pause because of the XZ vulnerability, Ubuntu 24.04 is now available for install.
-
Linux Servers Targeted by Akira Ransomware
A group of bad actors who have already extorted $42 million have their sights set on the Linux platform.
-
TUXEDO Computers Unveils Linux Laptop Featuring AMD Ryzen CPU
This latest release is the first laptop to include the new CPU from Ryzen and Linux preinstalled.
-
XZ Gets the All-Clear
The back door xz vulnerability has been officially reverted for Fedora 40 and versions 38 and 39 were never affected.
-
Canonical Collaborates with Qualcomm on New Venture
This new joint effort is geared toward bringing Ubuntu and Ubuntu Core to Qualcomm-powered devices.
-
Kodi 21.0 Open-Source Entertainment Hub Released
After a year of development, the award-winning Kodi cross-platform, media center software is now available with many new additions and improvements.
-
Linux Usage Increases in Two Key Areas
If market share is your thing, you'll be happy to know that Linux is on the rise in two areas that, if they keep climbing, could have serious meaning for Linux's future.
-
Vulnerability Discovered in xz Libraries
An urgent alert for Fedora 40 has been posted and users should pay attention.