Visualize your network with Skydive
Bird's-Eye View
If you don't speak fluent Ethernet, it sometimes helps to get a graphical view of what your network is doing. Skydive offers visual insights that could reveal complex error patterns.
A picture is worth a thousand words, and sometimes, a visual image of your network can save you hours of troubleshooting. Skydive [1] is an open source network analyzer designed to provide a graphical representation of the IT components and how they interact. I'm not talking about wiring but about the data flows between the nodes. Skydive stores this information in a central location. You can interact with Skydive using a web interface, the command line, or an API.
Skydive consists of a central analyzer and many agents (Figure 1). The agents run on Linux hosts and report network configuration and statistics to the analyzer. The analyzer listens to feedback from its agents and stores the input in a database. Gradually, the analyzer gets to know the entire topology and traffic flows between endpoints. The admin can access the new Skydive instance via the analyzer's web interface.
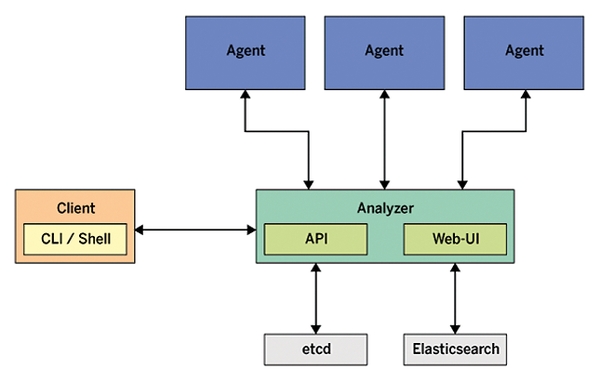
Agents act as "dumb" data forwarders. The brain of the analyzer is a NoSQL database, either Elasticsearch or OrientDB. Skydive scales horizontally: If an analyzer is at capacity with its agents, additional analyzers can step in and serve additional agents. The analyzers fill the same database with flow information while keeping their configurations in sync using etcd
.
Installation
Skydive's Github repository [2] provides a precompiled binary that is ready to use after download. If you don't trust this convenience, grab a build host with a compiler and compile the code yourself (Listing 1).
Listing 1
Building Skydive on CentOS
# yum install go git make protobuf protobuf-c-compiler \ npm patch libxml2-devel libvirt-devel libpcap-devel \ protobuf-devel # mkdir $HOME/go # export GOPATH=$HOME/go # export PATH=$GOPATH/bin:$PATH # mkdir -p $GOPATH/src/github.com/skydive-project # git clone https://github.com/skydive-project/skydive.git \ $GOPATH/src/github.com/skydive-project/skydive # cd $GOPATH/src/github.com/skydive-project/skydive # make # make install
The result is an executable file that works as an analyzer or as an agent depending on how it is called. Workable service files for Systemd are provided in the contrib/
directory of the repository. The service retrieves the settings from a configuration file in YAML format, which you will find in etc/
in typical Linux style.
Getting Started
The all-in-one scenario, which runs the agent and analyzer on the same host, is a good choice for getting to know Skydive. After you call skydive allinone
, the two components launch immediately and explore the operating system and the network adapters. The analyzer's web interface listens on http://localhost:8082 and lets you browse the new environment without any risks.
The most basic configuration is nothing but a short interlude because the analyzer keeps this data in RAM instead of using persistent storage on the file system. After restarting the software, all the information and settings will be lost. However, Skydive is also capable of storing the explored topology and flow information in an Elasticsearch database. Skydive does not put too much strain on the database server. In simple setups, the database can run on the same host as the analyzer. In either case, Elasticsearch needs to accept the analyzer's connection attempts. No further knowledge of Elasticsearch or NoSQL is needed; Skydive uses the database more like a dumb data silo.
In the sample configuration from Listing 2, the analyzer learns of its new storage facility in a neighboring database system. It is also important to authenticate the web interface because – by default – web access works without a login. The example uses the modest capabilities of Skydive and stores the user accounts in the htpasswd
file typical of Apache. For demanding environments, an upstream reverse proxy implements almost arbitrary login scenarios.
Listing 2
Analyzer Using Elasticsearch
analyzer: listen: 0.0.0.0:8082 flow: backend: myelasticsearch topology: backend: myelasticsearch auth: api: backend: mybasic storage: myelasticsearch: driver: elasticsearch host: 172.31.28.51:9200 ssl_insecure: true etcd: embedded: true auth: mybasic: type: basic file: /etc/skydive/skydive.htpasswd
If Firewalld controls network access to the server, the instructions in Listing 3 create an exception for Skydive. With this exception, the analyzer is ready for updates from its agents and the watchful eye of the admin on the web interface.
Listing 3
Firewalld Configuration
# firewall-cmd --permanent --add-port=8082/tcp # firewall-cmd --reload
Agent
The Skydive agent works like an informer that listens as a regular Linux service on a server, on a virtual machine, or in a container. The configuration file tells the agent which protocols and system areas it needs to monitor and which analyzer is responsible for it.
For its discovery tour, the agent can explore a wide variety of topologies: Open vSwitch, Docker, OpenStack, Linux containers, Libvirt, but also the classic neighborhood protocol LLDP. Libvirt support opens the door for exploring major virtualization platforms such as KVM, Qemu, Xen, and VMware ESXi. From the list of topologies, select the ones you want Skydive to explore.
The configuration file in the repository contains all the directives with examples and default values. By default, the agent uses only Netlink and Netns. The configuration file contains only the specification of the analyzer and is rather short:
analyzers: - analyzer.example.net:8082
Once the agent has launched, it disappears into the background and communicates with its analyzer. The relationship is a give-and-take affair. The agent receives work orders and provides information such as a host's profile, IPv4/v6 addresses, network adapter utilization, or the ARP and routing table.
Granted: The same values can also be found using the matching Linux commands. The big advantage Skydive offers is that the details from all the agents are available before troubleshooting starts. The transmitted work instructions ultimately come from the operator in front of the screen and are: collect flows and inject packets.
Buy this article as PDF
(incl. VAT)
Buy Linux Magazine
Subscribe to our Linux Newsletters
Find Linux and Open Source Jobs
Subscribe to our ADMIN Newsletters
Support Our Work
Linux Magazine content is made possible with support from readers like you. Please consider contributing when you’ve found an article to be beneficial.
News
-
Canonical Bumps LTS Support to 12 years
If you're worried that your Ubuntu LTS release won't be supported long enough to last, Canonical has a surprise for you in the form of 12 years of security coverage.
-
Fedora 40 Beta Released Soon
With the official release of Fedora 40 coming in April, it's almost time to download the beta and see what's new.
-
New Pentesting Distribution to Compete with Kali Linux
SnoopGod is now available for your testing needs
-
Juno Computers Launches Another Linux Laptop
If you're looking for a powerhouse laptop that runs Ubuntu, the Juno Computers Neptune 17 v6 should be on your radar.
-
ZorinOS 17.1 Released, Includes Improved Windows App Support
If you need or desire to run Windows applications on Linux, there's one distribution intent on making that easier for you and its new release further improves that feature.
-
Linux Market Share Surpasses 4% for the First Time
Look out Windows and macOS, Linux is on the rise and has even topped ChromeOS to become the fourth most widely used OS around the globe.
-
KDE’s Plasma 6 Officially Available
KDE’s Plasma 6.0 "Megarelease" has happened, and it's brimming with new features, polish, and performance.
-
Latest Version of Tails Unleashed
Tails 6.0 is based on Debian 12 and includes GNOME 43.
-
KDE Announces New Slimbook V with Plenty of Power and KDE’s Plasma 6
If you're a fan of KDE Plasma, you'll be thrilled to hear they've announced a new Slimbook with an AMD CPU and the latest version of KDE Plasma desktop.
-
Monthly Sponsorship Includes Early Access to elementary OS 8
If you want to get a glimpse of what's in the pipeline for elementary OS 8, just set up a monthly sponsorship to help fund its continued existence.