
Perl scripts analyze Jawbone UP data
To counter the widespread tendency to excessive body fat, many smartphone owners now carry little gadgets around with them, reminding them of their lack of physical activity during the day. If you sit motionless for hours in front of the screen, the idea is that such a device could motivate you to walk around the block more often, or at least use the upstairs bathroom. This trend toward self-measurement – known as quantifying yourself – has grown very popular lately.
An electronic bracelet like the UP [1] by Jawbone measures the steps you take and shows the distance traveled and calories burned in the associated smartphone app (Figure 1). The accessory is available in three sizes and several colors and costs about US$ 130. From a functional point of view, the device seems to capture only instantaneous acceleration values and accumulates them over time. The geographical position of the wearer could be determined with a GPS chip, but this added function would probably drain the device's small battery in next to no time.
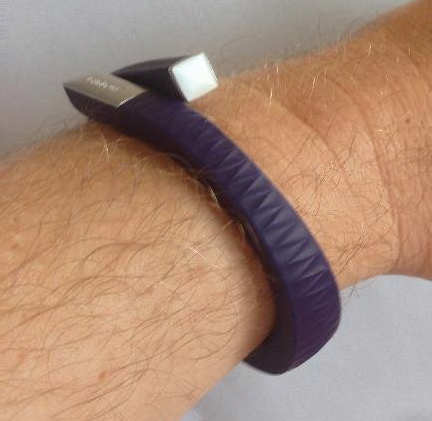 Figure 1: The Jawbone UP bracelet tallies its wearer's physical activity during the day by tracking acceleration.
[...]
Buy this article as PDF
(incl. VAT)
Buy Linux Magazine
Subscribe to our Linux Newsletters
Find Linux and Open Source Jobs
Subscribe to our ADMIN Newsletters
Support Our Work
Linux Magazine content is made possible with support from readers like you. Please consider contributing when you’ve found an article to be beneficial.

News
-
Container-Based Fedora Hummingbird Designed for Agent-First Builders
Fedora Hummingbird brings the same approach to the host OS as it does to containers to level up security.
-
Linux kernel Developers Considering a Kill Switch
With the rise of Linux vulnerabilities, the kernel developers are now considering adding a component that could help temporarily mitigate against them… in the form of a kill switch.
-
Fedora 44 Now Gaming Ready
The latest version of Fedora has been released with gaming support.
-
Manjaro 26.1 Preview Unveils New Features
The latest Manjaro 26.1 preview has been released with new desktop versions, a new kernel, and more.
-
Microsoft Issues Warning About Linux Vulnerability
The company behind Windows has released information about a flaw that affects millions of Linux systems.
-
Is AI Coming to Your Ubuntu Desktop?
According to the VP of Engineering at Canonical, AI could soon be added to the Ubuntu desktop distribution.
-
Framework Laptop 13 Pro Competes with the Best
Framework has released what might be considered the MacBook of Linux devices.
-
The Latest CachyOS Features Supercharged Kernel
The latest release of CachyOS brings with it an enhanced version of the latest Linux kernel.
-
Kernel 7.0 Is a Bit More Rusty
Linux kernel 7.0 has been released for general availability, with Rust finally getting its due.
-
France Says "Au Revoir" to Microsoft
In a move that should surprise no one, France announced plans to reduce its reliance on US technology, and Microsoft Windows is the first to get the boot.