In statistical computations, intuition can be very misleading

Guess Again

Article from Issue 178/2015
Author(s):

Even hardened scientists can make mistakes when interpreting statistics. Mathematical experiments can give you the right ideas to prevent this from happening, and quick simulations in Perl nicely illustrate and support the learning process.

If you hand somebody a die in a game of Ludo [1], and they throw a one on each of their first three turns, they are likely to become suspicious and check the sides of the die. That's just relying on intuition – but when can you scientifically demonstrate that the dice are loaded (Figure 1)? After five throws that all come up as ones? After ten throws?

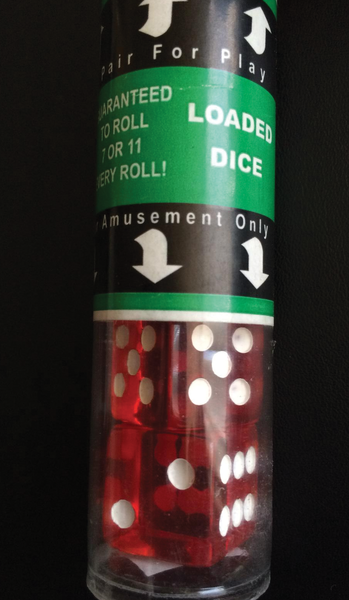
Figure 1: These dice, purchased in Las Vegas, always come up with winning combinations.

Each experiment with dice is a game of probabilities. What exactly happens is a product of chance. It is not so much the results of a single throw that are relevant, but the tendency. A player could throw a one, three times in succession from pure bad luck. Although the odds are pretty low, it still happens, and you would be ill advised to jump to conclusions about the dice based on such a small number of attempts.

The Value of p

For this experiment, a scientist would start by defining a so-called null hypothesis (e.g., "The die is fair" or "The medication shows no effect in patients"). On the basis of the test results, this hypothesis would be either confirmed or rejected later on. The mistake of rejecting a correct null hypothesis is known by statisticians as a "Type I error" or an "Error of the first kind." Experiments define up front the maximum acceptable probability of this event happening; this value is known as the significance level of the experiment.

Another statistical tool, the so-called "p-value" [2], is a probability value between 0 and 1 that can be computed during the experiment and that states how likely it is to see the result you just found – or one that is even more extreme (Figure 2). The smaller the p-value, the more significant the test; thus, the null hypothesis is highly likely to be incorrect.

Figure 2: The p-value expresses the probability of the experiment returning even "more extreme" values than the ones found. Source: Wikipedia.

For example, if you toss a coin 20 times and it comes up heads 14 times (10 is what you would expect), the p-value of 0.115 is still well above the threshold value of 5 percent (0.05), which is typical for scientific experiments [3]. The scientist can thus accept the null hypothesis ("The coin is fair") with a clear conscience and demonstrate with a maximum error probability of 5 percent that the coin has dropped as expected. If the coin came up heads 15 times out of 20 tosses, instead of 14, the p-value would drop to 0.041 – below the 5 percent threshold – and both the null hypothesis and the quality of the coin would be begin to look questionable.

To Err is Human

The Perl script in Listing 1 [4] throws a good coin with the sides H (for heads) and T (for tails) a total of 1,000 times and then adds the number of times that it came up heads. The p_value() function starting in line 23 then computes the p-value from the observed result. The script's output helps you decide whether the coin tosses are regular, or whether there is an anomaly:

$ ./coin-toss
Rounds:  1000
Tails:   507
p-value: 0.182979

Listing 1

coin-toss


In this example, out of 1,000 tosses, the coin came up heads 507 times; the p-value is thus 0.18 and well above the threshold value of 5 percent. This means that there's no good reason to reject the null hypothesis.

The script randomly chooses the H or T symbol in the @sides array in each of the 1,000 rounds, thereby deciding whether heads or tails was thrown. In the latter case, the $tails counter in line 13 is incremented by 1 for the tally output and p-value calculation later on.

Looking for Extremes

So, how do you compute the value of p? If the coin comes up heads 7 times from 10 throws in the experiment, then 8, 9, or 10 times heads would be an even more extreme result. Because the coin is symmetrical, and 8, 9, or 10 times tails is "more extreme" as well, the value of p also includes these values. The probability of k tosses coming up heads in an experiment with a series of n binomial distributed tosses is computed from the binomial coefficient (n/k) divided by the total number of combinations (2n):

The p_value() function in lines 23-45 uses the CPAN Math::BigFloat module to compute the binomial coefficient and for the ensuing division. The downstream steps in longer experiments result in numeric values that exceed the floating point capacity of most computers by far, whereas Math::BigFloat computes with an arbitrary degree of accuracy even when faced with values featuring a couple of thousand digits.

The bnok() method in line 36 computes the binomial coefficient (n/k), and line 37 accumulates a subtotal with badd(). If the value is below the expected average value (e.g., 10 out of 20 tosses), the algorithm looks for more extreme values to the left (i.e., in increasing order from 1, 2, … , up to the value shown in the experiment).

However, if the experimental value is on the right-hand side of the bell curve, it counts from this value up to the maximum value. In both cases, line 43 multiplies the result by 2 because of the symmetry of the experiment (heads and tails are interchangeable).

Buy this article as PDF

Express-Checkout as PDF
Price $2.95
(incl. VAT)

Buy Linux Magazine

SINGLE ISSUES
 
SUBSCRIPTIONS
 
TABLET & SMARTPHONE APPS
Get it on Google Play

US / Canada

Get it on Google Play

UK / Australia

Related content

  • Python generators simulate gambling

    Can 10 heads in a row really occur in a coin toss? Or, can the lucky numbers in the lottery be 1, 2, 3, 4, 5, 6? We investigate the law of large numbers.

  • Calculating Probability

    To tackle mathematical problems with conditional probabilities, math buffs rely on Bayes' formula or discrete distributions, generated by short Perl scripts.

  • Welcome

    When Facebook renamed itself Meta in honor of its new vision of a virtual reality metaverse, I knew they were taking their initiative very seriously. I will admit, though, it was a little difficult to figure out what they were talking about.

  • Qiskit

    Qiskit is an open source framework that aims to make quantum computing technology both understandable and ready for production.

  • R For Science

    The R programming language is a universal tool for data analysis and machine learning.

comments powered by Disqus
Subscribe to our Linux Newsletters
Find Linux and Open Source Jobs
Subscribe to our ADMIN Newsletters

Support Our Work

Linux Magazine content is made possible with support from readers like you. Please consider contributing when you’ve found an article to be beneficial.

Learn More

News