
A plotting library
Data Structures
As far as data structures are concerned, no matter how you define and fill a sequence of values, Matplotlib will internally convert it to the special arrays provided by NumPy, because those are the formats that its plotting functions can handle. In most cases, you should directly use the same arrays anyway, as shown in the examples that follow, because they are faster to process than normal Python arrays and consume less memory.
Matplotlib Gallery
With the general concepts presented above in mind, I will use some simple, but very different, examples to create plots with Matplotlib. You can easily adapt the following examples to a variety of use cases.
A Basic Plot with Line Styling
The Matplotlib code in Listing 3 generates the plot shown in Figure 1. After loading pyplot and NumPy in the first two lines, Listing 3 defines a variable t that increases in steps of 0.2 units in the interval from to 5 (line 4). Lines 6 to 8 show how to plot three different curves, each with its unique style and label. The format of the strings used to style the lines is hard to memorize because it has lots of options, but it's not cryptic once you know that the first letter is the color and the rest are a more or less symbolic alias for the line style: 'r--' creates a dashed red line, 'bs' creates another line marked with blue squares, and 'g^' creates a third line made of green triangles. The default format string is 'b-', which is a solid blue line. Lines 10 to 12 add the legend and title and save the plot to a file.
Listing 3
Basic Plot
01 import Matplotlib.pyplot as plt
02 import NumPy as np
03
04 t = np.arange(0., 5., 0.2)
05
06 plt.plot(t, t,'r--',label='Linear')
07 plt.plot(t, t**2, 'bs', label='Quadratic')
08 plt.plot(t, t**3, 'g^', label='Cubic')
09
10 plt.legend()
11 plt.title("Different rates of growth")
12 plt.savefig('basic-styling.png')
13 plt.show()
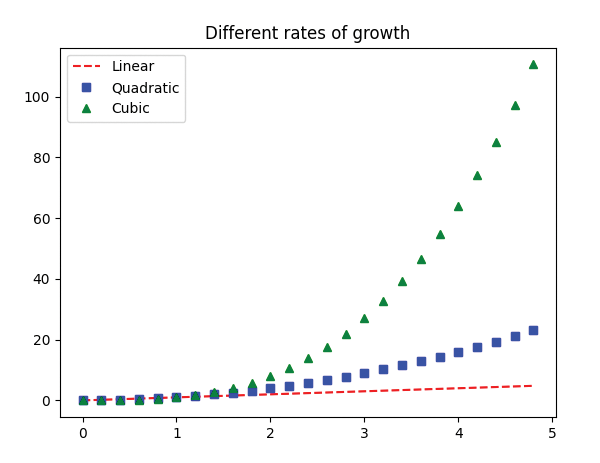 Figure 1: A really basic plot still looks nice thanks to Matplotlib styling options.
Line 13 of Listing 3 opens the chart in the graphical interface shown in Figure 2, which, at least on Ubuntu, comes with the standard Matplotlib package. In this interface, aside from modifying the styles, you can also zoom in, drag the figure around to look at a specific zone, change the size of any subplot, and save the results of your edits.
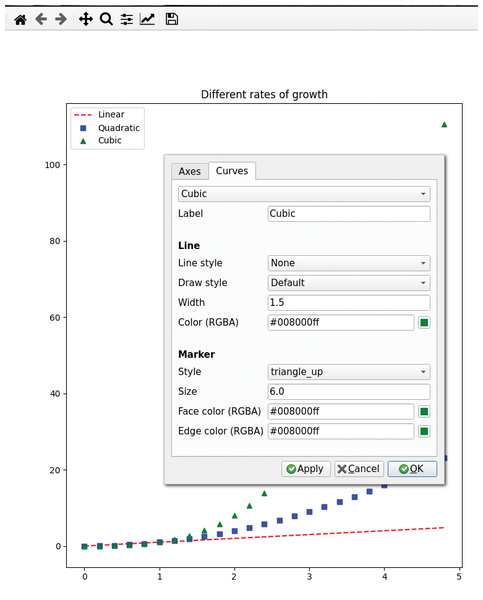 Figure 2: The basic Matplotlib interface for Linux lets you try out different formatting options.
Buy this article as PDF
(incl. VAT)
Buy Linux Magazine
US / Canada
UK / Australia
Subscribe to our Linux Newsletters
Find Linux and Open Source Jobs
Subscribe to our ADMIN Newsletters
Support Our Work
Linux Magazine content is made possible with support from readers like you. Please consider contributing when you’ve found an article to be beneficial.

News
-
Fedora Asahi 40 Remix Available for Macs with Apple Silicon
If you've been anticipating KDE's Plasma 6 for your Apple Silicon-powered Mac, then you're in luck.
-
Red Hat Adds New Deployment Option for Enterprise Linux Platforms
Red Hat has re-imagined enterprise Linux for an AI future with Image Mode.
-
OSJH and LPI Release 2024 Open Source Pros Job Survey Results
See what open source professionals look for in a new role.
-
Proton 9.0-1 Released to Improve Gaming with Steam
The latest release of Proton 9 adds several improvements and fixes an issue that has been problematic for Linux users.
-
So Long Neofetch and Thanks for the Info
Today is a day that every Linux user who enjoys bragging about their system(s) will mourn, as Neofetch has come to an end.
-
Ubuntu 24.04 Comes with a “Flaw"
If you're thinking you might want to upgrade from your current Ubuntu release to the latest, there's something you might want to consider before doing so.
-
Canonical Releases Ubuntu 24.04
After a brief pause because of the XZ vulnerability, Ubuntu 24.04 is now available for install.
-
Linux Servers Targeted by Akira Ransomware
A group of bad actors who have already extorted $42 million have their sights set on the Linux platform.
-
TUXEDO Computers Unveils Linux Laptop Featuring AMD Ryzen CPU
This latest release is the first laptop to include the new CPU from Ryzen and Linux preinstalled.
-
XZ Gets the All-Clear
The back door xz vulnerability has been officially reverted for Fedora 40 and versions 38 and 39 were never affected.