Predicting the productivity of a solar array with Perl

Solar Power Leashed

© Lead Image © Vlada Grechko, 123RF.com

© Lead Image © Vlada Grechko, 123RF.com

Article from Issue 268/2023
Author(s):

A forecast service and some Perl magic help predict the solar power yield of a residential photovoltaic array.

The current energy crisis has led many homeowners to invest in solar power. More people than ever are choosing to install photovoltaic generation systems on their rooftops for domestic use. Depending on how much money is invested on such systems, homeowners could see their power bills cut in half or even have them reduced to nothing.

Solar is not all advantages, though: Power generation represents a huge upfront investment that will take more than a decade to recoup. Another huge disadvantage, however, is that photovoltaic arrays are only productive if the weather is willing to cooperate (Figure 1).

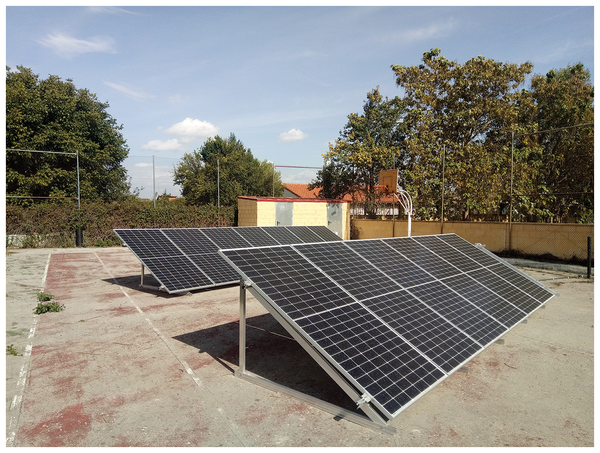
Figure 1: Two photovoltaic arrays provide more power than a regular house needs – but only if the weather cooperates.

A house equipped with a photovoltaic set (Table 1) might become truly self-sufficient, as long as it is well managed. However, to optimize the use of solar power, it is important to predict the daily power yield of the system. If you have access to an accurate forecast, you can plan ahead.

Table 1

Hardware Budget*

Item

Quantity

Total Price (EUR)^

Hybrid inverter

1

1,730.30

Panel (450W)

13

3,303.30

Battery module (5kWh)

3

7,314.45

Total


12,346.05

* 5,910W photovoltaic system, wiring excluded.

^ Prices are roughly equivalent in US dollars.

Imagine, for example, that you are planning to turn your yearly fruit yield into jam in a given week. That undertaking is an energy-intensive task. If you know tomorrow's weather is not going to cooperate with your solar, but the day after tomorrow you will have favorable conditions, you can adjust your schedule and take advantage of the sun. On the other hand, if your photovoltaic installation is off-grid (in island mode), you will need to know in advance which days are going to be bad and how long a generator would need to run to compensate for cloudy weather.

Keep in mind that using power-hungry appliances while the sun is not shinning might still make some sense. See the "Solar Power Without the Sun" box for more information.

Solar Power Without the Sun

Solar systems usually work alongside the traditional power grid. The idea is that the house will pull power from the solar system and, if solar yield is not enough to satisfy the demand, get as much power from the grid as necessary to have the sum of solar power and grid power equal to the load.

Solar systems only generate power while the sun is shinning, but people often need electricity during off-productive hours. Two main strategies are used by homeowners to benefit from solar arrays after sunset. The first is signing a contract with a power supply company, which will buy the power you produce while you are not using it. This way, if you are not home during the day, your solar arrays will produce power for your power supply company. When you return home at night and turn on an electric stove, you will buy power straight from the grid, but the hope is that the money generated during the day will offset the cost of purchasing electricity during dark hours. This approach has the advantage of being cheap (i.e., it does not require the owner to build out a special infrastructure); however, it is more beneficial for power suppliers than for homeowners. Typically, power distributors buy your power for much less than they sell it back to you.

The second strategy is to add a battery set to the solar system (Figure 2). The objective is to have the solar arrays charge the batteries during the day so you have energy stored for when you need it. The advantage of this approach is that it is more flexible and makes you less dependant on regular power suppliers. If your area experiences regular blackouts or power (load) shedding (a temporary reduction in supply of electrical power), you will be able to use battery power. The main disadvantages are the huge upfront cost of battery banks and the increased complexity of the deployment. Also, not all solar systems equipped with batteries are blackout proof, and some will cease operating if the grid goes down because of the way they are designed.

Figure 2: A Turbo Energy hybrid inverter (1) paired with a battery bank in a rack (2). The photovoltaic panels charge the batteries with excess production, so the owner can use battery power after the sun sets.

Both strategies benefit from proper planning of power consumption. Somebody who sells power to the grid will still find it preferable to use electricity while solar is working at its best, instead of doing so at night and having to buy power – even if the costs are partially offset by the power sold earlier. On the other hand, the owner of a solar system with a battery bank will be better off using electric power at noon rather than draining energy from the battery needlessly at night.

Solar Irradiance Forecast

Forecast services that give you an estimation of the power yield of a solar array are great for two reasons. First, they allow you to simulate the performance of a solar array you intend to install before you make the investment. It is much better to know that the panels you intend to install are going to under perform or over perform before you spend your money. Second, they allow you to schedule your power expenditure so as to optimize the usage of your system.

A very useful forecast service free of charge for hobbyists, students, and academic research is Solcast [1]. The biggest advantage of the service is that it allows you to download solar irradiance predictions in machine-parseable formats, which can then be fed to scripts and programs to extract meaningful data.

After signing up with Solcast, you are expected to define a Site before you start using the service (Figure 3), which is just a fancy way of saying you need to provide your location to Solcast so they can send you that location's forecasts. To complete your information on the Site tab, you need to provide the orientation angle of your panels, their nominal power output, the vertical angle of the panels, and an efficiency estimation. It is safe to assume 90 percent efficiency for new systems, with a 2 percent efficiency loss per year.

Figure 3: After signing up with Solcast, you must create a site for your solar array before you can download forecast data.

Solcast also provides an API key (Figure 4) you can use to download forecasts automatically. Your site's page on the Solcast website will provide plenty of documentation and a wizard for generating valid HTTP calls. To save time, the following example downloads 72 hours of forecast data for the specified site:

Figure 4: Solcast has a limited wizard that can help you assemble an API call for downloading a solar irradiation forecast in a machine-parseable format.
https://api.solcast.com.au/rooftop_sites/$YOUR_SITE_ID/forecasts?hours=72&format=csv&api_key=$YOUR_KEY

This URL leads to a CSV file (e.g., Figure 5) and can be fetched with curl, wget, or any other downloader of your liking. Don't forget to replace $YOUR_SITE_ID and $YOUR_KEY with the ID code for your photovoltaic site and your API key. The meaning of each API variable is explained in Table 2 and the content of the CSV file in Table 3.

Table 2

Solcast API Variables

Variable

Description

hours

Number of hours covered by the forecast

format

Format; JSON, CSV, and XML are available

api_key

Your private API key provided by Solcast

Table 3

Forecast File Elements

Element

Description

PvEstimate

Average power production (kW) for the time period

PvEstimate10

Reasonable minimum power yield for the period (for worst case calculations)

PvEstimate90

Reasonable maximum power yield for the period (for best case calculations)

PeriodEnd

Timestamp marking the end of the period

Period

Length of each period (minutes)

Figure 5: Forecast data as downloaded by the Solcast API.

Parsing the Forecast

The Solcast forecast data lets you perform a number of calculations. The most important are how much power the panels will produce each of the upcoming days and whether you will face a power deficit. Because the forecast is in a machine-parseable format already, you can use some simple Perl scripts to reveal these numbers. Perl is well suited for the task because it is superb for processing text. You can install the necessary environment on a Devuan computer with the commands as root:

apt-get update
apt-get -y install perl libdatetime-perl

Perl has a number of modules for parsing CSV files, such as the one downloaded with the forecast data, but you don't need anything fancy and can make do with some homemade code. Listing 1 shows an example Perl script that reads from standard input and, assuming it is fed a CSV file, saves its contents to an array named @csv.

Listing 1

solar_01.pl

01 #!/usr/bin/perl
02
03 # Usage: ./solar_01.pl < forecast_file.csv
04 # where each data row from the csv file has the following format:
05 #
06 # PvEstimate,PvEstimate10,PvEstimate90,PeriodEnd,Period
07 # 0.4645,0.3248,0.5801,2022-11-03T11:00:00Z,PT30M
08
09 my $line_number = "0";
10 my @csv;
11
12 # Read from standard input and process each CSV line sequentially.
13 while ( my $line = <>) {
14
15   # Remove Windows-style EOL
16   $line =~ s/\R/\012/;
17   chomp ($line);
18
19   # Split each row of the CVS file and get the fields we want.
20   my ($power,$timestamp) = (split "," , $line)[0,3];
21
22   ${csv[$line_number]}{"power"} = $power;
23   ${csv[$line_number]}{"timestamp"} = $timestamp;
24
25   ++$line_number;
26
27 }
28
29 exit;

The while loop in the script reads each line from the forecast file one by one and stores them in the $line variable. Lines 15-17 remove Windows-style newlines, making the input easier to process. Each line of the CSV file is composed of a group of fields separated by commas, so line 20 captures the first and forth field and stores them in the $power and $timestamp variables.

The code that follows is where tricky stuff starts happening. In lines 22 and 23, a data hash is created and stored in the element of the csv array corresponding to the current line (i.e., the first line of the file goes into $csv[0], the second line into $csv[1], etc.). In this way, you can access both the power and the timestamp of each row easily: For example, to get the power column of the 10th line, access the ${csv[9]}{"power"} variable.

In the context of solar power production, one of the most interesting things you can do with this data is compare your solar production with your power consumption.

Consumption Profile

An average Spanish house consumes 9.55kWh daily [2] (US, ~25kWh [3]; UK ~11kWh [4]). You can calculate how much your own house consumes in a number of ways. If you have a solar inverter installed in your house, the inverter itself will tell you what your power consumption profile looks like. If you have not installed a solar system yet, look at one of your electricity bills for the number of kilowatt-hours billed and divide by the number of days of the billing period.

Ideally, you would use an hour-per-hour comparison to try and guess which is the best time of the day for using and which is the best time for saving electrical power at your home. For that to happen, you need to know your consumption profile. Again, if you have a smart inverter, it can give you this information, but if your inverter is dumb or you have no solar system yet, you will need to make a rough estimation.

An acceptable way of making your hourly consumption estimation is to grab the nationwide consumption estimations of your country and assume your house behaves close to the average. For example, I downloaded the generation data from Red ElÈctrica de EspaÒa [5], which provides a CSV file with the power generated in Spain (in megawatts) throughout the day, broken down to periods of five minutes. This data allowed me to calculate which percentage of Spain's power consumption is generated each hour. I can then safely assume that my own home will behave in a similar way.

In other words, if I guess that 5 percent of Spain's power generation occurs between 12:00pm and 12:05pm, I can extrapolate that my house will take 5 percent of its daily power during that time. Listing 2 is a consumption profile from such an extrapolation, and Figure 6 is a graph of that data. The first column is the timestamp belonging to the end of a one-hour metered period, and the second column is the percentage of the total daily power usage that takes place in that period.

Listing 2

Electric Consumption, Spain

§§nonumnrt
Date,Percentage of Daily Consumption
2022-11-02 00:30,1.56020056433848
2022-11-02 01:00,1.56020056433848
2022-11-02 01:30,1.63088497829003
2022-11-02 02:00,1.63088497829003
2022-11-02 02:30,1.58141212721891
2022-11-02 03:00,1.58141212721891
2022-11-02 03:30,1.56087988890132
2022-11-02 04:00,1.56087988890132
2022-11-02 04:30,1.57097271097776
2022-11-02 05:00,1.57097271097776
2022-11-02 05:30,1.62759926560856
2022-11-02 06:00,1.62759926560856
2022-11-02 06:30,1.85454912466257
2022-11-02 07:00,1.85454912466257
2022-11-02 07:30,2.11453633949703
2022-11-02 08:00,2.11453633949703
2022-11-02 08:30,2.22951548769889
2022-11-02 09:00,2.22951548769889
2022-11-02 09:30,2.22946696451583
2022-11-02 10:00,2.22946696451583
2022-11-02 10:30,2.21253930551125
2022-11-02 11:00,2.21253930551125
2022-11-02 11:30,2.20946154932860
2022-11-02 12:00,2.20946154932860
2022-11-02 12:30,2.26549889387938
2022-11-02 13:00,2.26549889387938
2022-11-02 13:30,2.28922673039563
2022-11-02 14:00,2.28922673039563
2022-11-02 14:30,2.29525746886163
2022-11-02 15:00,2.29525746886163
2022-11-02 15:30,2.27086417154914
2022-11-02 16:00,2.27086417154914
2022-11-02 16:30,2.27188315839339
2022-11-02 17:00,2.27188315839339
2022-11-02 17:30,2.27048984985125
2022-11-02 18:00,2.27048984985125
2022-11-02 18:30,2.37193796186272
2022-11-02 19:00,2.37193796186272
2022-11-02 19:30,2.45179325741258
2022-11-02 20:00,2.45179325741258
2022-11-02 20:30,2.47148673785156
2022-11-02 21:00,2.47148673785156
2022-11-02 21:30,2.38225260420458
2022-11-02 22:00,2.38225260420458
2022-11-02 22:30,2.15359750186017
2022-11-02 23:00,2.15359750186017
2022-11-02 23:30,1.96871031063571
2022-11-03 00:00,1.96871031063571
Figure 6: Power consumption profile in Spain on February 11, 2022.

Buy this article as PDF

Express-Checkout as PDF
Price $2.95
(incl. VAT)

Buy Linux Magazine

SINGLE ISSUES
 
SUBSCRIPTIONS
 
TABLET & SMARTPHONE APPS
Get it on Google Play

US / Canada

Get it on Google Play

UK / Australia

Related content

comments powered by Disqus
Subscribe to our Linux Newsletters
Find Linux and Open Source Jobs
Subscribe to our ADMIN Newsletters

Support Our Work

Linux Magazine content is made possible with support from readers like you. Please consider contributing when you’ve found an article to be beneficial.

Learn More

News