
Predicting the productivity of a solar array with Perl
The current energy crisis has led many homeowners to invest in solar power. More people than ever are choosing to install photovoltaic generation systems on their rooftops for domestic use. Depending on how much money is invested on such systems, homeowners could see their power bills cut in half or even have them reduced to nothing.
Solar is not all advantages, though: Power generation represents a huge upfront investment that will take more than a decade to recoup. Another huge disadvantage, however, is that photovoltaic arrays are only productive if the weather is willing to cooperate (Figure 1).
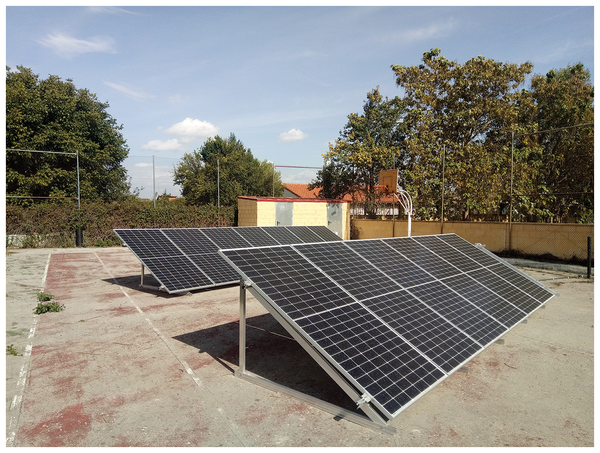 Figure 1: Two photovoltaic arrays provide more power than a regular house needs – but only if the weather cooperates.
[...]
Buy this article as PDF
(incl. VAT)
Buy Linux Magazine
Subscribe to our Linux Newsletters
Find Linux and Open Source Jobs
Subscribe to our ADMIN Newsletters
Support Our Work
Linux Magazine content is made possible with support from readers like you. Please consider contributing when you’ve found an article to be beneficial.

News
-
CIQ Releases Compatibility Catalog for Rocky Linux
The company behind Rocky Linux is making an open catalog available to developers, hobbyists, and other contributors, so they can verify and publish compatibility with the CIQ lineup.
-
KDE Gets Some Resuscitation
KDE is bringing back two themes that vanished a few years ago, putting a bit more air under its wings.
-
Ubuntu 26.04 Beta Arrives with Some Surprises
Ubuntu 26.04 is almost here, but the beta version has been released, and it might surprise some people.
-
Ubuntu MATE Dev Leaving After 12 years
Martin Wimpress, the maintainer of Ubuntu MATE, is now searching for his successor. Are you the next in line?
-
Kali Linux Waxes Nostalgic with BackTrack Mode
For those who've used Kali Linux since its inception, the changes with the new release are sure to put a smile on your face.
-
Gnome 50 Smooths Out NVIDIA GPU Issues
Gamers rejoice, your favorite pastime just got better with Gnome 50 and NVIDIA GPUs.
-
System76 Retools Thelio Desktop
The new Thelio Mira has landed with improved performance, repairability, and front-facing ports alongside a high-quality tempered glass facade.
-
Some Linux Distros Skirt Age Verification Laws
After California introduced an age verification law recently, open source operating system developers have had to get creative with how they deal with it.
-
UN Creates Open Source Portal
In a quest to strengthen open source collaboration, the United Nations Office of Information and Communications Technology has created a new portal.
-
Latest Linux Kernel RC Contains Changes Galore
Linux kernel 7.0-rc3 includes more changes than have been made in a single release in recent history.