
Unified Event Monitoring with Splunk
By
Secure your enterprise, monitor system performance, and more by harnessing the power of Splunk to search, monitor, report, and analyze events and data from any source.

Systems administrators, security engineers, and analysts share a common challenge in typical enterprise environments. Rare is the data center in which only one operating system is in use, or only one version of the same operating system. Monitoring and managing system events and security events across such hybrid environments is no small feat.
In this article, I intend to give special attention to the process of shipping various events, including Windows events, off to a single collection source via agents and syslog, particularly in *nix-heavy environments, where syslog might be the de facto standard.
Although I’ll focus mainly on security event monitoring and correlation, you can use these methods for performance and system monitoring and optimization as well.
The centerpiece of this discussion is Splunk. The Splunk website says that Splunk is “… software that provides unique visibility across your entire IT infrastructure from one place in real time. Splunk enables you to search, report, monitor, and analyze streaming and historical data from any source.”
On Splunk’s website, you’ll see numerous humorous references to Splunk’s capabilities:
- Taking the sh out of IT.
- Log is my co-pilot.
- All batbelt, no tights.
- Australian for grep (my favorite).
To be certain, these are coy marketing phrases, but they are accurate, as I will show in this article.
Assumptions
This article assumes that you’re familiar with the basic premise of Splunk and have heard of or used OSSEC (a host-based intrusion detection system) and Snare (auditing and event-log manager).
Some choices need to be made when unifying events in a hybrid event. For example, perhaps you have more of one operating system flavor than another in your environment. Or, perhaps you prefer one operating system over another. No matter what your system counts, preferences, or comfort zones, Splunk can serve you well.
To monitor your systems you can choose to use various channels in concert or exclusively:
- Both host types can also run Splunk as a light-forwarding agent.
- Windows and *nix hosts can also be monitored with Snare agents.
- Windows and *nix hosts can be monitored with OSSEC agents.
- Network devices can send syslog output directly to the Splunk server.
Depending on granularity, performance, and primary business driver, you can opt for some or all of the above. Personally, I tend to favor a combination of the Splunk light-forwarding method in concert with OSSEC agents, and syslog for network devices.
Methodology
By default, Splunk is installed in /opt/splunk. Establish the $SPLUNK_HOME environment variable: export SPLUNK_HOME=/opt/splunk/. Also, you might want to add $SPLUNK_HOME/bin in your PATH to make Splunk commands readily accessible.
Because installation and configuration are described in this article, there are a number of steps that require a Splunk restart. Rather than repeat myself, every time a restart is required, you’ll see this symbol: ø.
From the command line (CLI), splunk restartss will be your steady partner.
Splunk Installation
Installing Splunk is a point-and-click exercise on Windows. On a Linux server, just follow your typical package manager methodology.
I conducted all efforts for this article on Debian and Ubuntu servers; initial installation is as simple as executing
sudo dpkg -i splunk-4.<current version and architecture>
followed by:
sudo /opt/splunk/bin/splunk start
Then browse to http://localhost:8000 or the DNS name for your Splunk server.
Once you’re through the initial process, a couple of vital steps are needed to unify event collection across disparate systems. Most importantly, you’ll need to change the Splunk admin password: Click Manager in the upper right menu bar and then select User options.
At splunk | Manager | System settings | General settings, I prefer to enable HTTPS and change the web port to something off the beaten path.
Receiving events from other Splunk forwarders (see “Splunk Forwarding”) is a critical part of unifying events in hybrid environments. Your central Splunk server must be configured to act as a “receiver.”
Use splunk | Manager | Forwarding and receiving | Forward data | Add New to establish a listening port to set up your primary server to receive data from another forwarder. Next, configure your Splunk installation to receive syslog events from remote systems.
Going to splunk | Manager | Data inputs allows you to configure data inputs. As you’re likely well aware, syslog traverses UDP 514, so click UDP, add a data input for 514, and set the host for IP. IP sets the UDP input processor to rewrite the host with the IP address of the remote server. Additionally, you can opt to set up a TCP 514 listener if you plan more stateful gathering of syslog events.
Now head back to splunk | Launcher, where you’ll want to Browse more Apps. At a minimum, you’re going to want to install Splunk for Windows, Splunk for Unix and Linux, Splunk for OSSEC, and, optionally, AfterGlow Graphing to gather events across various operating systems. Additionally, you might opt to collect and manage events from network devices, like Cisco, F5, Blue Coat, and others. And, you might want to install the UI Examples for 4.1 app. This set of XML-based views and navigation menus provides a collection of example views, including table drill-down, chart drill-down, real-time dashboards, and using post-process in dashboards and form searches. See the “Dashboards” section for more details.
Splunk Forwarding for *nix Hosts or Windows Hosts
As indicated in the installation section, be sure to install Splunk for *nix and Splunk for Windows on your receiving Splunk server and define a port from which it “receives” forwarded data.
Click Manager, then Forwarding and receiving, then Add New under Receive data and tell Splunk on which port to listen.
On hosts from which you want to forward data via Splunk for *nix or Splunk for Windows, you can choose to set forwarding defaults in a way that does not store local copies and only forwards events to your central Splunk server. Undertake the following steps in order. If you’re a GUI fan and you enable light forwarding before setting up general forwarding, you’ll be limited to the command-line interface (CLI).
- Enable the system-appropriate app via splunk | Launcher or splunk | Manager | Apps. ø
- Configure inputs for the Unix app at splunk | Manager | unix or splunk | Manager | windows on a Windows host. Because my focus is security-centric, I don’t choose to enable all inputs; you might choose to take a broader approach if you’re monitoring system events as well.
- At splunk | Manager | Forwarding and receiving | Forwarding defaults, select the No radio button for local storage. Use splunk | Manager | All configurations to enable or disable objects to your liking; there are 243 for the Unix (*NIX) app. Firewall, audit, escalated user privilege, network connections, and open ports can be very useful from a security perspective.
- Via splunk | Manager | Forwarding and receiving | Forward data | Add New add the host:port or IP:port combination for your central server with receiving enabled. ø
- For security’s sake, I prefer to enable light forwarding, which disables Splunk Web; you must use the Splunk CLI to manage each host configured in this manner. ø
To reiterate, the frequency with which you poll a system for events, along with the events you choose to collect are contributors to the load on your core Splunk system and storage footprint. Choose only events that you really find useful, and don’t hesitate to start small. As an example, under Splunk for *nix, select Users, then Successful User Logins. This method is often a good audit exercise, because an attacker might use a known good account (Figure 1).
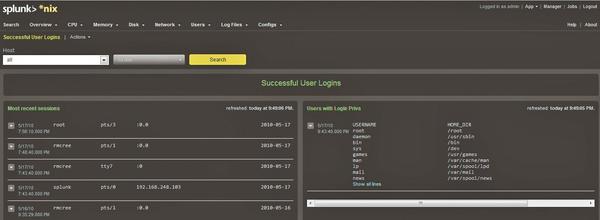 Figure 1: Successful user access audit via Splunk for *nix.
Similar process and audit activity can be facilitated via the Splunk for Windows app.
Snare Agent for Windows
The Snare Agent for Windows is an application offered by InterSect Alliance that is useful in hybrid environments. Most importantly, and simply, Snare converts Window events to syslog for receipt by a central collector. Note that Snare agents are available for multiple operating systems; explore the InterSect Alliance website for possible uses and documentation.
Two versions of the Snare Agent exist for Windows; the distinction is important depending on the versions of Windows you use in your environments. Snare for Windows, compatible with Windows XP or Windows 2003 and earlier systems, interacts with the underlying Windows Eventlog subsystem to facilitate remote, real-time transfer of event log information and also supports 64-bit versions of Windows.
Snare for Windows Vista provides the same service for Windows 2008, Vista, and Windows 7 systems. The newer version of the Windows eventlog subsystem has changed significantly; ensure the use of the correct agent as you review your systems. Snare Agent for Windows manages event logs from the Security, Application, and System logs, as well as the new DNS, File Replication Service, and Active Directory logs. If you choose the supported version (at a cost) of the agent, you can monitor custom Windows event logs. Windows log data is converted to text format, delivered to a remote Snare Server, or, in this scenario, to your Splunk server enabled to receive syslog events.
Splunk for OSSEC
OSSEC is an open source host-based, intrusion detection system (HIDS) that performs log analysis, file integrity checking, policy monitoring, rootkit detection, real-time alerting, and active response. OSSEC runs on most operating systems, including Linux, Mac OS, Solaris, HP-UX, AIX, and Windows.
Agents are installed on systems you want to monitor, which then report to an OSSEC server, which in turn can report to Splunk for searching and correlation. The Splunk for OSSEC app makes managing OSSEC events quite convenient. The easiest way to facilitate Splunk and OSSEC is to maintain your OSSEC server on the same host as your Splunk server.
Here’s a quick overview of OSSEC installation; for further details, see my OSSEC article in the ISSA Journal.
Download the latest version of OSSEC and execute the following:
tar -zxvf ossec-hids-*.tar.gzcd ossec-hids-*sudo ./install.sh
Choose the server configuration when you take this step on the Splunk server. Be sure to allow port 1514 (UDP) if you’re using your server firewall so that agents can connect. Execute /var/ossec/bin/ossec-control start to start OSSEC HIDS.
I followed all recommended conventions and installed the OSSEC server on my Ubuntu 9.04 servers. Furthermore, I installed the OSSEC Windows agent on a variety of Windows XP, 2003, and 7 systems. Installing the OSSEC for Windows agent is a point-and-click effort until you need to join the agent to the server. When prompted by the Windows agent, engage a terminal on the server and do the following in order:
- Issue sudo /var/ossec/bin/manage_agents
- Choose A to add an agent and provide the name, IP, and ID for the new agent.
- Return to the menu and choose E to extract the key for the new agent, copy the key to a file or your clipboard, and make it available to the Windows host on which you’re installing the agent.
- On said Windows host, provide the OSSEC server IP and the agent key you extracted in step 3, save, and then start the agent.
- From the manage_agents menu, you can confirm that the agent is running in the agent UI on the Windows host, and you can also choose L to list agents on the server.
Installing OSSEC as an agent on *nix systems follows the same conventions as the server installation, with the exception of choosing the agent option when prompted during installation. Follow the same key process as described for Windows (albeit CLI) to join the agent to the server.
The actual Splunk for OSSEC app is better installed manually following Ray Nutting’s recommendations.
- Via splunk | Manager | Apps, select Create app.
- Name and label should logically be OSSEC.
- Choose the Yes radio button to make the app visible and describe the app as OSSEC events of interest or something of your choosing.
- The bare-bones template will suffice.
- Save your new app.
- Extract the ossec.tgz compressed archive in the Splunk apps directory, as root.
- Enter tar zxf ossec.tgz -C $HOME
- Now cp -rf $HOME/ossec/* $SPLUNK_HOME/etc/apps/OSSEC (assuming you named the app OSSEC).
- In $SPLUNK_HOME/etc/apps/ossec/defaults/inputs.conf, set disabled = false under the Local Server heading. ø
Also, you can enable OSSEC syslog forwarding, wherein OSSEC is configured to forward to your Splunk server when you enable data input as specified under the syslog-based heading (udp:10002, sourcetype:ossec).
To further clarify, if all OSSEC agents are reporting to your OSSEC server, which is monitored by Splunk as a local resource, you eliminate the need for additional syslog input, and Splunk can simply draw from /var/ossec/logs/alerts/alerts* on the same server.
Now navigate to what should equate to https://splunkServer:splunkPort/en-US/app/OSSEC/ if you followed the conventions above, then click Dashboards and select the OSSEC Dashboard (see Figure 2).
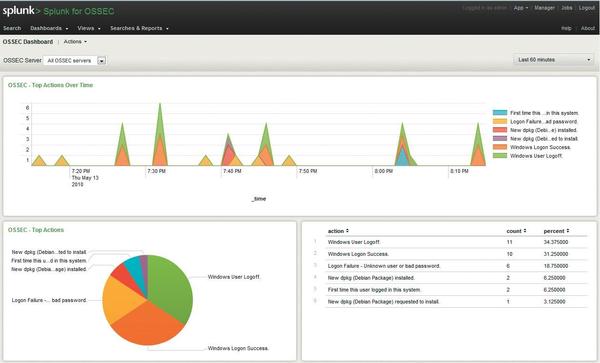 Figure 2: Splunk for OSSEC dashboard.
One of the events noted in Figure 2 indicates the installation of a new package. As an arbitrary “investigation,” I selected Search from the Splunk for OSSEC menu bar and queried for New dpkg (Debian Package) installed. The result was complete event data that I could export by selecting Actions then Export results (Figure 3).
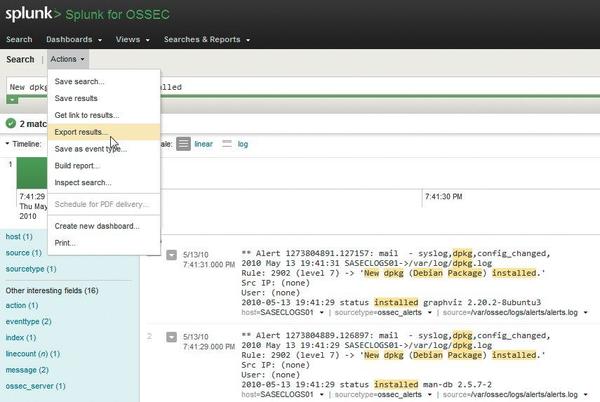 Figure 3: Export OSSEC search results.
For your consideration, the /dev/random website offers an OSSEC event flow tutorial worthy of your review if you are an ardent OSSEC user.
Well-formed search strings are an inherent part of successful Splunk use; details follow.
Searches
Interactive searching is quite simply the most vital skillset to ensure that your use of Splunk is as comprehensive as possible when building dashboards, views, and reports. Even the process of building alerts starts with a relevant search string. Review Search interactively with Splunk Web and practice diligently on collected events. In the following examples, I build an “events of interest” dashboard for my own use.
Imagine you’re receiving a syslog feed from NetScreen devices, and you’d like to see only traffic that has been denied, but you don’t want traffic to internal destination IPs, and you only want to return the last 10 events.
sourcetype=syslog netscreen action=deny NOT dst=192.168.0.0/16 NOT dst=10.0.0.0/8 | head 10
Pretty logical, yes? Perhaps you’re monitoring a Windows host, and you’re interested in failed login attempts.
host="MYLOGSERVER01" Type="Failure Audit"
This query would return all related events as captured via forwarding from MYLOGSERVER01 and the Splunk for Windows app with a sourcetype of WinEventLog:Security (Figure 4).
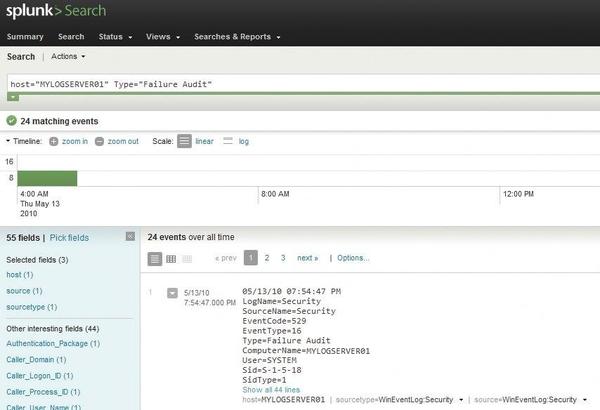 Figure 4: Failed logon attempt on a Windows host.
Search elements can be piped into additional processing steps and can include logfile resources as well as indices. Such searches are useful in building chart panels for dashboards.
index=_internal source="*metrics.log" group=per_sourcetype_thruput | timechart sum(kb) by series
The Search app offers a search assistant as well. Right under the search form, you’ll note a white down arrow in a green box. If it doesn’t automatically open by default, click it, and make use of the feedback as you build queries. Also, further your understanding of fields and tags to enhance your search swagger.
Dashboards
Now that you’re gathering data from multiple and disparate resources and you’re up to speed on basic search techniques, you’ll likely want to unify events into single clickable views. A great way to get started with building dashboards is to install the UI Examples for 4.1 app, as mentioned in the “Splunk Installation” section.
Dashboards typically reside in $SPLUNK_HOME/etc/apps/<yourApp>/default/data/ui/views/. Either edit the XML directly or through the Splunk Manager.
In the UI Examples, dashboard4.xml is a great starting point for experimenting with dashboards. With the same methodology used to add the Splunk for OSSEC app, I created a HolisticInfoSec app then copied dashboard4.xml to $SPLUNK_HOME/etc/apps/HolisticInfoSec/default/data/ui/views/ and renamed it to dashboardHolisticInfosec.xml.
I find row-based, drill-down dashboard panels to be very useful, and I enable the drill-down option wherever possible. To edit your dashboards on the fly, navigate to your app of choice, select the Dashboards drop-down menu, then the Actions drop-down menu to Edit dashboard (Figure 5).
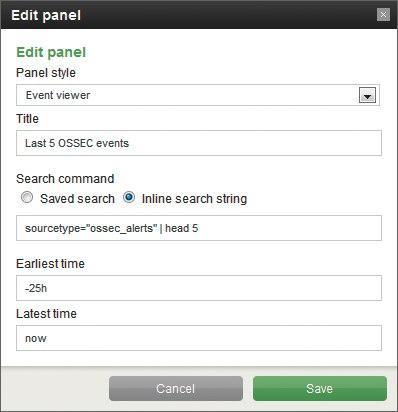 Figure 5: Making dashboard panel changes from the Edit panel dialog.
As mentioned in the “Searches” section, dashboard entities are built via searches. If you prefer simply to edit the dashboard XML, the search string
sourcetype="ossec_alerts" | head 5
translates into XML for the dashboard as in Listing 1.
Listing 1: Dashboard XML
01 <event>
02 <searchString>sourcetype="ossec_alerts" | head 5</searchString>
03       <title>Last 5 OSSEC events</title>
04       <earliestTime>-25h</earliestTime>
05       <latestTime>now</latestTime>
06 </event>
Feel free to customize additional dashboards according to your preferences and requirements. Even if there are additional dashboards beyond those included with apps such as Splunk for OSSEC, *nix, and Windows, there is no limit to the customization and the specificity available to you in Splunk views.
Alerts
What good is gathering and unifying all these events if you can’t generate alerts when certain triggers are met? As with all Splunk capabilities, a relevant search is the building block for an alert.
Assuming you have a reasonable baseline for traffic on your network, you can assume that at no time should one of your hosts open a TCP listener on port 6667 – a known port for IRC bots. Given that the Splunk for *nix app can track open ports, a basic query to trap a bot might be sourcetype="openPorts" 6667. Choose Save search then check Schedule search. Select the interval at which you’d like the search run – as frequently as every minute or as infrequently as once a week. When defining actions performance, you can have an email sent every time the search runs or only if certain conditions are met (Figure 6).
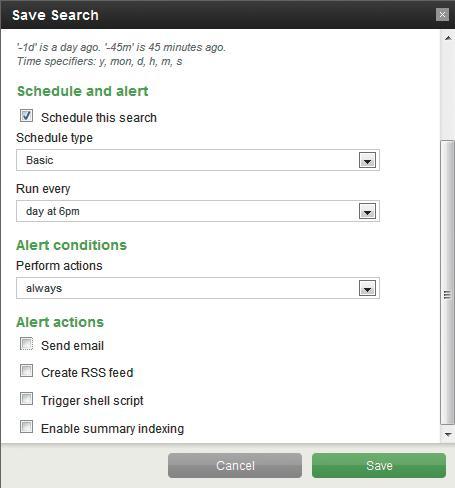 Figure 6: Save and schedule searches for alerting.
Assuming your mail service or smarthost is configured properly, you’ll receive an alert when conditions are met, inclusive of event details if configured accordingly (Figure 7).
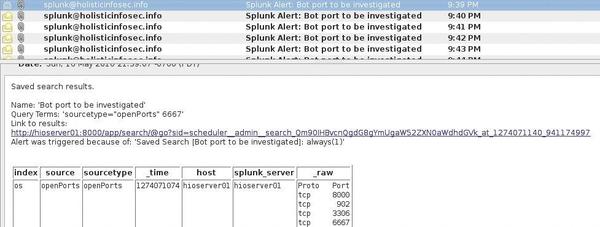 Figure 7: Splunk alert email.
Additional actions, including shell script triggers, RSS feed creation, or summary indexing actions can be enabled as well. Note: Scheduled searches (Alerts) require a commercial license.
Troubleshooting and Recommendations
When in doubt, restart Splunk. Be wary of the quality control on some of the Splunk apps you might want to try out. Missing configuration files, failed or no porting to Splunk 4.1, and other issues could leave you frustrated and burning cycles.
Don’t forget about host-based firewall settings; they can confound and annoy if enabled without clearly defined allow rules for important event traffic.
To keep unnecessary data to a minimum, consider collecting and forwarding only what you really need or find interesting. Doing so will reduce your Splunk data footprint and potentially reduce licensing costs. Another option is to manage a central syslog server, wherein you drop unneeded events via regex filters before they are sent on to Splunk.
Summary
The options available for Splunk use in diverse data centers could fill a book. Although my focus in this article has been security-centric, keep in mind that the possibilities are endless with regard to events specific to your interests. In this discussion, I left out a number of details that you can pursue on your own, such use of various indexes, producing reports, and advanced charting. Consider this discussion your entry point.
In a larger environment, it’s pretty easy to bounce up against free license limits, but for environments that write gigabytes of event data daily, enterprise licensing is likely a reasonable expenditure. Regardless of your intended use, or the scale of your deployment, you will find Splunk very useful for unifying events in hybrid operating environments.
next page » 1 2 3
Subscribe to our Linux Newsletters
Find Linux and Open Source Jobs
Subscribe to our ADMIN Newsletters
Support Our Work
Linux Magazine content is made possible with support from readers like you. Please consider contributing when you’ve found an article to be beneficial.

News
-
Substantial Update to IPFire Now Available
The lastest version of IPFire features a fundamental change to how the system handles DNS.
-
Gnome Working on Test Center App to Make Testing Easier
It's now possible to test experimental features on the Gnome desktop without worrying that you'll break things.
-
New Vulnerability Discovered in Linux Kernel
Hiding out for nearly 15 years, the Ghostlock vulnerability allows a standard logged-in user to gain root privileges.
-
New Linux Flaw Lets Attackers Escape VMs
A 16-year-old vulnerability allows an attacker to escape a virtual machine, gain access to the host, and execute malicious code.
-
Hannah Montana Linux Is Back!
Developer Noah Cagle decided the world needed the once obscure but beloved Linux distribution and gave it a decidedly pink refresh.
-
System76 Refreshes the Lemur Laptop
If you're looking for a laptop with tons of power and battery, look no further than the latest iteration of the System76 Lemur Pro.
-
More than 43 Million Lines of Code in Linux Kernel 7.2
Using the cloc utility, Michael Larabel of Phoronix discovered that Linux kernel 7.2 has over 43 million lines of code.
-
Kubuntu Focus Goes Ultra
The Kubuntu Focus team has upped the performance ante of its M2 and Zr laptops with the latest, greatest CPUs from Intel.
-
Linux Gamers May Soon See Less Mouse Lag in KDE Plasma
Gamers using KDE’s Plasma desktop have been suffering from a slight input delay in mouse movement that could lead to getting fragged.
-
Three Lines of Code Improve Linux Storage Performance
A developer changed three lines of code, giving Linux storage performance a 5% bump.