The sys admin's daily grind: SparkFun
Trouble in the Air
Is your neighbor burning the wrong kind of wood or did a couple of VWs just pass by your house? Charly finds out with a sensor. For an attractive approach to visualizing boring measurement figures, you can either use your own web server or rely on a specialized service like SparkFun.
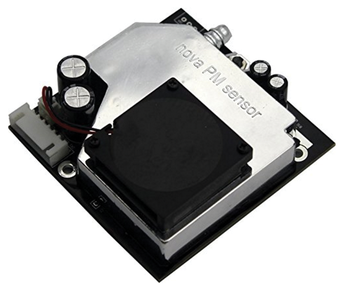
I ordered a particulate matter sensor from smog-experienced China (Figure 1), connected it to a Raspberry Pi, and can now see with up-to-the-minute accuracy when a neighbor has a fire in their wood-burning stove and even tell if the wood was properly dried. I use RRDtool to create illustrative graphs from the particulate matter readings that I get once every minute and upload them to my web server [1].
 Figure 1: The particulate matter sensor from the Far East that Charly connected to his Raspberry Pi.
I could even do without the web server, because number of services handle storage and visualization of measurement data for you, if so desired. One of them, SparkFun, lets you store your data simply with an HTTP call.
[...]
Buy this article as PDF
(incl. VAT)
Buy Linux Magazine
Subscribe to our Linux Newsletters
Find Linux and Open Source Jobs
Subscribe to our ADMIN Newsletters
Support Our Work
Linux Magazine content is made possible with support from readers like you. Please consider contributing when you’ve found an article to be beneficial.

News
-
LibreOffice 26.2 Now Available
With new features, improvements, and bug fixes, LibreOffice 26.2 delivers a modern, polished office suite without compromise.
-
Linux Kernel Project Releases Project Continuity Document
What happens to Linux when there's no Linus? It's a question many of us have asked over the years, and it seems it's also on the minds of the Linux kernel project.
-
Mecha Systems Introduces Linux Handheld
Mecha Systems has revealed its Mecha Comet, a new handheld computer powered by – you guessed it – Linux.
-
MX Linux 25.1 Features Dual Init System ISO
The latest release of MX Linux caters to lovers of two different init systems and even offers instructions on how to transition.
-
Photoshop on Linux?
A developer has patched Wine so that it'll run specific versions of Photoshop that depend on Adobe Creative Cloud.
-
Linux Mint 22.3 Now Available with New Tools
Linux Mint 22.3 has been released with a pair of new tools for system admins and some pretty cool new features.
-
New Linux Malware Targets Cloud-Based Linux Installations
VoidLink, a new Linux malware, should be of real concern because of its stealth and customization.
-
Say Goodbye to Middle-Mouse Paste
Both Gnome and Firefox have proposed getting rid of a long-time favorite Linux feature.
-
Manjaro 26.0 Primary Desktop Environments Default to Wayland
If you want to stick with X.Org, you'll be limited to the desktop environments you can choose.
-
Mozilla Plans to AI-ify Firefox
With a new CEO in control, Mozilla is doubling down on a strategy of trust, all the while leaning into AI.

