Process Tracing

Core Technology

Article from Issue 197/2017
Author(s):

Ever wondered what processes are currently doing on your system? Linux has a capable mechanism to answer your questions.

Processes are, in general, units of isolation within a Unix system. This perhaps is the most important abstraction the kernel provides, because it implies that malicious or badly written programs can never affect proper ones. Isolation is the foundation of safety, but sometimes you want to turn it off.

Think of the interactive GNU Debugger (GDB) (Figure 1). You'd certainly want it to stop your code execution at specified points or execute it step-by-step, and it is hardly useful if it can't add watches or otherwise peek into the program being debugged; however, the debugger and the program it debugs are two different, isolated processes, so how could it ever happen?

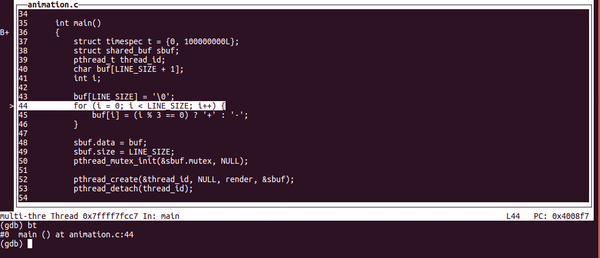
Figure 1: GDB comes with an interactive text-mode user interface, too. To enter or leave, type C-x C-a (TUI key bindings [1]).

You can't have rules without exceptions, and in Unix, a so-called process tracing mechanism called ptrace() answers this problem and has many other tricks up its sleeve.

Meet ptrace()

A gateway to process tracing in Linux is the ptrace() system call [2]. It allows one process, called a "tracer," to control execution, examine memory, modify CPU registers, and otherwise interfere with another process, known as the "tracee." Many popular tools, like the aforementioned GDB or the famous strace (system call tracer) command rely on ptrace() for their operation.

As many system calls with long histories (think ioctl()), ptrace is a multiplexer that does a myriad of things: attaches to the tracee and stops and resumes it, modifies memory and registers, updates signal handlers, and retrieves events, to name a few. Yet it accepts just four arguments: the type of request to issue, a process ID of the tracee, and two void * pointers, addr and data. The addr pointer usually conveys the address in the tracee's memory, and data is an exchange buffer in the tracer's address space. You get a result either as a prtrace return value (if it fits within long, which is typically 64 bits these days) or through the data buffer.

The kernel treats processes that are being traced somewhat differently from the others. When such a process receives a signal, the kernel stops it. This happens even if the tracee is set to ignore the signal. The kernel may also stop the tracee when its forks, calls execve() to run a new executable, or in fact does any system call. If single-step execution is desired, the kernel employs hardware-specific mechanisms (e.g., a TF flag in x86) to stop the tracee after each machine code instruction.

Before you can do useful things with ptrace(), you must attach a tracer to the tracee. This happens when you run:

gdb -p PROCESS_ID

Attachment is per thread, not per process as a whole, so in theory, you can attach a debugger to one thread, leaving others intact.

To attach to a tracee, you issue a PTRACE_ATTACH request and set the pid argument to the tracee's process ID. In this case, addr and data are unused:

#include <sys/ptrace.h>
ptrace(PTRACE_ATTACH, pid, 0, 0);

Originally, process tracing was permitted between any processes running under the same UID, unless a process was especially put in an undumpable state with a prctl() system call or (sometimes) via a setuid operation [3].

#include <sys/prctl.h>
prctl(PR_SET_DUMPABLE, 0, ...);

This solution wasn't perfect security-wise, so the Yama security module, which first appeared in Linux 3.4, introduced a ptrace_scope concept. A sysctl setting allows you to switch between classic behavior and restricted mode, in which case, parents can only trace their children. Alternatively, a process must declare some PID as a debugger, again with the prctl() system call:

prctl(PR_SET_PTRACER, pid, ...);

Desktop crash handlers (e.g., Dr. Konqi in KDE) often exploit this opportunity. Finally, you can enable admin-only attachment, in which case only root processes with CAP_SYS_PTRACE capability can act as tracers, or you can disable the feature altogether.

When you attach a tracer to the process, the kernel sends the tracee a SIGSTOP signal to stop it. If you don't want this to happen, use the PTRACE_SEIZE request, again introduced in Linux 3.4. To stop such a tracee at any later time, issue PTRACE_INTERRUPT.

You can also set up process tracing the other way around. In this case, the tracee issues a PTRACE_TRACEME request to have its parent start tracing itself. This sounds a bit counterintuitive and is hardly useful unless the parent is prepared to trace the child. A typical approach is to fork the tracer, issue a PTRACE_TRACEME from the fork, and then make the child run whatever program you want to trace.

When you no longer want to trace a process, issue a PTRACE_DETACH request. This is what the detach command in GDB does internally. The tracee must be stopped beforehand, usually when it gets a signal or issues a system call. Remember, you usually type Ctrl+C before detaching in GDB. Although this seems natural, now you know the real reason.

Some (Executable) Pseudocode

ptrace() is a Unix system call, so its native API is in C, which is okay for the low-level mechanism that ptrace() is, but for the sake of this article, I want something with fewer nuts and bolts involved. Luckily, such a tool exists. Python-ptrace [4] wraps all ptrace() goodies in a neat Python interface. Moreover, it includes a fully functional (yet relatively simple) debugger that you can dissect to learn ptrace() operation from a real-world example.

Python-ptrace uses ctypes to build a high-level ptrace API and is Python 2/3 compatible. It also includes faster (but not pure Python) bindings in a module called cptrace. Two high-level classes are provided, ptrace.debugger.PtraceDebugger and ptrace.debugger.PtraceProcess, which represents a process traced by a PtraceDebugger. Many PtraceProcess methods simply wrap corresponding ptrace() calls, but a few others are a bit more sophisticated.

The debugger is found in gdb.py (Figure 2), and it implements most basic GDB commands but ignores anything not directly related to the debugging itself. Thus, it won't load debugging symbols or show you the sources, which is a problem of its own (see the "Source-Level Debugging" box). In fact, it won't even show you the disassembly unless you have the diStorm disassembler [5] installed. All basic features are present and functional, though.

Figure 2: The gdb.py command-line debugger showing some disassembly (note the breakpoint instructions) and a backtrace. It works, but it isn't too informative.

Source-Level Debugging

Although it is possible to install breakpoints and read a program's memory (including code) with ptrace(), you only get machine instructions. However, programmers prefer to think in terms of source code lines. Mapping these to each other is a separate and non-trivial task that involves two major components: the sources and the debugging symbols. The debugging symbols link machine code locations to source code lines.

When you compile your code with gcc -g (or the equivalent clang option), debugging symbols are embedded within the resulting executable, which makes the binary bigger (much bigger) and is usually unwanted on production systems. So many distributions now ship symbols in separate packages, often with -dbg or -debuginfo suffixes. Symbols are usually installed under /usr/lib/debug, where debuggers such as GDB can find them and load at run time.

A de facto standard format to convey debugging information is DWARF (naturally, a companion term to ELF). The DWARF specification is several hundred pages in size, which hopefully gives an indication of the amount of work required to create a source-level debugger and provides a hint as to why gdb.py (with a thousand lines of Python code) doesn't step further than disassembly.

The tracer process often runs a sort of event loop. It instructs the kernel to schedule a tracee with PTRACE_CONT and then calls waitpid() to wait for the tracee's status change. When the tracee stops, waitpid() returns, and the tracer goes into action. It examines the status output argument to waitpid() with WIFSTOPPED(), WIFSTOPSIG(), and other macros, as usual, to learn what caused this stop. It can be an "ordinary signal" (e.g., SIGINT), which the tracer probably injects back into the tracee, or it can be a SIGTRAP, which informs the tracer that something of interest has happened, such as a breakpoint hit or system call entered or returned.

After the tracer decides what to do with the signal, it issues a PTRACE_CONT request, telling the kernel which signal it wants to inject into the tracee (if any). Then the tracee resumes and the loop commences the next iteration.

Peeking into Memory

Imagine you run a program under gdb.py, and it stops for whatever reason. You want to examine which instructions it was executing before the stop and type the where command. The debugger prints some machine code or a raw hex dump (Figure 2) if you don't have diStorm. How has gdp.py achieved this?

The where command handler does some argument parsing and then calls the PtraceProcess.dumpCode() method, which retrieves an instruction pointer value (%rip register, if you are on x86-64) with PtraceProcess.getInstrPointer(). Next, it calls into a private PtraceProcess._dumpCode() method, which reads the tracee memory word-by-word with PtraceProcess.readBytes() and either passes it to the disassembler if it's present or just dumps hex data. Simplified versions of the getInstrPointer() method and the readWord() method, which reads a word of the tracee's memory, are shown in Listings 1 and 2, respectively.

Listing 1

Getting tracee's instruction pointer


Listing 2

Reading the tracee's memory


As you can see, they rely on two ptrace() requests. PTRACE_GETREGS returns the tracee's general purpose registers, which are naturally architecture dependent. You can find the exact layout in the sys/user.h file in the standard C library. Python-ptrace re-implements it in the ptrace.binding.linux_struct module, which you may find more human-readable. The register file is usually several hundred bytes in size, so ptrace puts it where the data argument points.

Not all architectures recognize the PTRACE_GETREGS request, so python-ptrace introduces a workaround. If support is missing, it issues PTRACE_PEEKUSER to read memory in a so-called "user area." The exact layout of this area is defined again in sys/user.h (hence the name) as struct user. The user area stores various tracee process data (e.g., the code or stack starting address), which may aid debugging. The addr argument stores the offset within the structure. Because the PTRACE_PEEKUSER result is not longer than a machine word, ptrace conveys it as a return value and ignores the data argument.

PTRACE_PEEKTEXT has the same semantics as PTRACE_PEEKUSER, except it reads process text (or code), not the user area. Also, PTRACE_PEEKDATA reads the program data, but in Linux, code and data live in a single address space, so these are synonymous. addr represents a virtual address to read from, and readBytes() loops as many times as needed to read the amount required. It is a good idea to supply PTRACE_PEEK* requests (and PTRACE_POKE requests, which you'll see in a second), with a word-aligned address (i.e., it starts at an 8-byte boundary on x86-64).

Buy this article as PDF

Express-Checkout as PDF
Price $2.95
(incl. VAT)

Buy Linux Magazine

SINGLE ISSUES
 
SUBSCRIPTIONS
 
TABLET & SMARTPHONE APPS
Get it on Google Play

US / Canada

Get it on Google Play

UK / Australia

Related content

  • Perl: Ptrace

    Linux lets users watch the kernel at work with a little help from Ptrace, a tool that both debuggers and malicious process kidnappers use. A CPAN module introduces this technology to Perl and, if this is not enough, C extensions add functionality.

  • Tracing Tools

    Programs rarely reveal what they are doing in the background, but a few clever tools, of interest to both programmers and administrators, monitor this activity and log system functions.

comments powered by Disqus
Subscribe to our Linux Newsletters
Find Linux and Open Source Jobs
Subscribe to our ADMIN Newsletters

Support Our Work

Linux Magazine content is made possible with support from readers like you. Please consider contributing when you’ve found an article to be beneficial.

Learn More

News