
Using Bash one-liners for stats
Add Statistics to a Plot
Gnuplot offers the ability to include stats on a plot using
gnuplot> plot 'filename' using column options, stat1 options, stat2 options, stat3 option ...
Figure 6 show how to put stats on a jitter plot. Here, multiple gnuplot statements were passed by the execute (-e) option. A semicolon (;) is used to separate each statement in the text string.
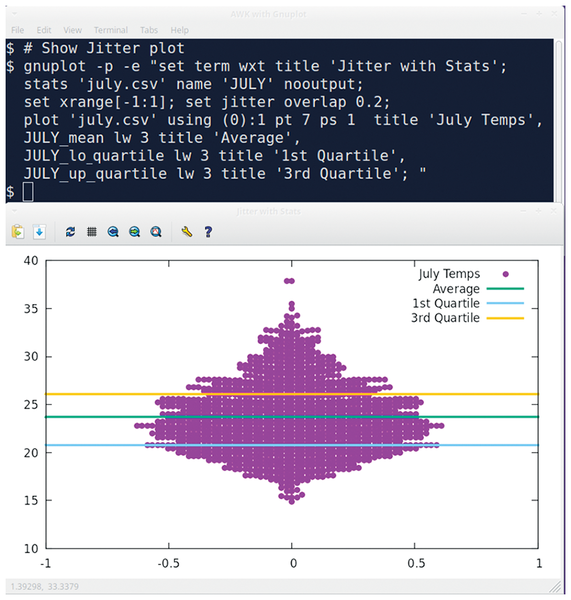 Figure 6: Show stats on a jitter plot.
To get the required presentation, jitter plots may need some tweaking of xrange, overlap, pt (point type 7=circle), and ps (point size). The jitter plot in Figure 6 uses a setting of (0):1, which configures the first column of data to be positioned around on the X-axis.
In Figure 6, stats were given a prefix name of JULY. The mean (JULY_mean), the first quartile (JULY_lo_quartile), and the third quartile (JULY_up_quartile) were added to the plot with a line width (lw) of 3.
Linear Regression
While linear regression in languages like R or Python is straightforward, it can be a challenge in SQL. Gnuplot stats will do a linear regression calculation when two columns are defined. If there is only a single column of data, a linear regression can be done against a row index by referencing to row (Listing 4).
Listing 4
Linear Regression with gnuplot
gnuplot># Do a linear regression based on a row index
gnuplot>stats 'july.csv' using 0:1
...
  Linear Model:       y = 0.001489 x + 22.74
  Slope:              0.001489 +- 0.0002746
  Intercept:          22.74 +- 0.2062
  Correlation:        r = 0.1488
Similar to what was done in the earlier jitter plot, linear regression stats can be included on a line chart. Figure 7 shows a combination of raw data, a curve fit, and the Y-mean. A gnuplot linear function of
y =m*x +b
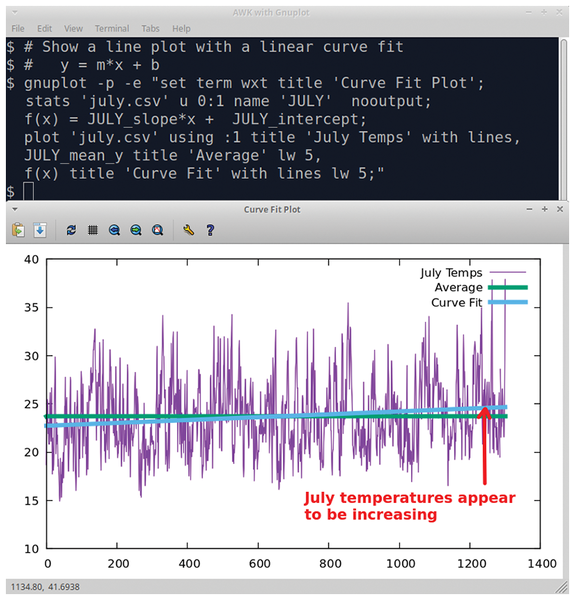 Figure 7: Create a curve fit in gnuplot.
is created that uses the stat variable JULY_slope for m and JULY_intercept for b. The Y-average (JULY_mean_y) and the f(x) function are added to the line plot with line widths (lw) of 5. Using this one rather long statement, I was able to see that there was a slight increase in July temperatures over the past 15 years.
Summary
AWK can be used to extract and format data similar to an SQL SELECT query statement. The filtered results from AWK can be piped to different command-line tools such as sort, sta, or gnuplot to do statistical calculations.
Gnuplot is an extremely powerful tool for data analysis and visualization, making it ideal for small Bash scripts. Typically gnuplot is used with a CSV data file, but it can also be used with SQL query output.
For quick stats and visual checks of CSV data, a AWK/gnuplot solution is a good addition to your data toolkit.
« Previous 1 2
Buy this article as PDF
(incl. VAT)
Buy Linux Magazine
US / Canada
UK / Australia
Subscribe to our Linux Newsletters
Find Linux and Open Source Jobs
Subscribe to our ADMIN Newsletters
Support Our Work
Linux Magazine content is made possible with support from readers like you. Please consider contributing when you’ve found an article to be beneficial.

News
-
Two Local Privilege Escalation Flaws Discovered in Linux
Qualys researchers have discovered two local privilege escalation vulnerabilities that allow hackers to gain root privileges on major Linux distributions.
-
New TUXEDO InfinityBook Pro Powered by AMD Ryzen AI 300
The TUXEDO InfinityBook Pro 14 Gen10 offers serious power that is ready for your business, development, or entertainment needs.
-
Danish Ministry of Digital Affairs Transitions to Linux
Another major organization has decided to kick Microsoft Windows and Office to the curb in favor of Linux.
-
Linux Mint 20 Reaches EOL
With Linux Mint 20 at its end of life, the time has arrived to upgrade to Linux Mint 22.
-
TuxCare Announces Support for AlmaLinux 9.2
Thanks to TuxCare, AlmaLinux 9.2 (and soon version 9.6) now enjoys years of ongoing patching and compliance.
-
Go-Based Botnet Attacking IoT Devices
Using an SSH credential brute-force attack, the Go-based PumaBot is exploiting IoT devices everywhere.
-
Plasma 6.5 Promises Better Memory Optimization
With the stable Plasma 6.4 on the horizon, KDE has a few new tricks up its sleeve for Plasma 6.5.
-
KaOS 2025.05 Officially Qt5 Free
If you're a fan of independent Linux distributions, the team behind KaOS is proud to announce the latest iteration that includes kernel 6.14 and KDE's Plasma 6.3.5.
-
Linux Kernel 6.15 Now Available
The latest Linux kernel is now available with several new features/improvements and the usual bug fixes.
-
Microsoft Makes Surprising WSL Announcement
In a move that might surprise some users, Microsoft has made Windows Subsystem for Linux open source.