
Elasticsearch, Logstash, and Kibana – The ELK stack
Output
Last, but not least, the output modules define what happens to the filter data. The configuration file, 9001-elasticsearch-output.conf, ensures that Logstash passes all the data to Elasticsearch:
output {
  elasticsearch {
    hosts => ["localhost:9201"]  }
}
The port number 9201 is not a typo – in our test environment, we have a reverse proxy server that listens on the Elasticsearch port 9200 and passes everything through to 9201.
Whereas earlier Logstash and Elasticsearch versions used a Java-based protocol, Logstash versions 2.0 and later use HTTP to talk to the Elasticsearch server. If you invested in the Shield plugin, you need to define authentication in the output module and enable SSL for the data transfer:
[...]
    hosts => ["localhost:9201"]
    user => username
        password => topsecret
    ssl => true
    cacert => '</path/to>/cert.pem'
[...]
By default, the indexes delivered by Logstash to Elasticsearch go by the name of logstash-%Y.%m.%d; in other words, they are uniquely identified by reference to their timestamps.
To avoid creating an infinite collection of data, you could manage the dataset manually, but you can also call on the Curator [18] tool to do this work for you. This is a Python script, which had reached version 3.4 when this issue went to press; we used this version in our lab environment. Curator optimizes the datasets by, for example, removing Logstash data that is more than seven days old:
/usr/local/bin/curator --host 127.0.0.1 \
  --port 9201 delete indices --timestring '%Y.%m.%d' \
  --prefix logstash --time-unit days --older-than 7
Because we deployed an Nginx proxy server in the lab environment, the last command defines a port number that departs from the standard. If you want to test in advance what will happen in a live run, you can use the --dry-run option; this command has to be placed before all the other parameters to make sure that Curator only simulates the task. The best place to keep the script is in a cron job to ensure that it automatically can take care of cleaning up in the future.
Kibana
The third and last component in the ELK stack is named Kibana [3] and comes courtesy of Elastic, as well. The program uses the Elasticsearch data to create attractive views and reports. In addition to real-time analysis, it is above all impresses with extremely flexible search algorithms and a variety of views for the information.
Kibana is also released under the Apache license; version 4.3.0 was released November 24, 2015. You can pick up the latest version as a tar.gz archive from the project website. Unfortunately, you do not have a choice of prebuilt packages or a repository, so you need to watch for updates yourself.
Below the Kibana archive, which resided in the /opt directory of our test machine, you will find the config subdirectory with the kibana.yml setup file; you will not normally need to do anything with this file – the defaults are meaningful and perfectly okay if Elasticsearch is running on the same machine. Below your bin directory, you will find the kibana start script. Kibana does not come with an init script or a systemd unit; administrators need to ensure that Kibana launches. Kibana includes its own web server, and you can access the interface in your browser (http://localhost:5601).
Without the previously mentioned Elasticsearch Shield plugin, you do not have user or rights management; in other words, any user will have access to the complete dataset at any time. Kibana supports SSL; you can store the certificate and key in the kibana.yml file.
We added a reverse proxy in the form of Nginx that not only retrofits SSL, but also a simple user authentication method based on htaccess and htpasswd (etc_nginx_sites-available/kibana [6]).
The Kibana web interface impresses across the board. Thanks to its responsive design, it also looks good on smaller displays. The first time you access the interface, you need to enter an index or accept the default setting of logstash-*; then, click on create, and Kibana is ready for use. The next step will take you to the Discover section, which collects all the events. You can click to unfold the entries and then see the tables and their data fields. The fields marked with an @ come from Elasticsearch; those that start with an underscore come from the input modules.
In the Discover section, you will find the search field that lets you send queries to Elasticsearch. You can store the search queries using the small icons to the right of the field and reload them later to avoid the need to keep reinventing the wheel. On the left side of the Kibana interface, you'll see the individual fields, which you can add to the filter criteria by pressing add.
Painting by Numbers
The graphical evaluations, finally, are created in the Visualize section. Step-by-step users can create various chart types or metrics that they compose from new or existing searches. For example, Kibana can answer questions about the distribution of encryption algorithms or discover the average size of email messages sorted by days and hours. In many cases, it only takes a couple of seconds for software to search through millions of individual values in the index and discover meaningful metrics – and this is something that grep, awk, and similar tools cannot do.
In the Dashboard section, you can compile the visualizations referred to earlier to create a complete image and arrange various views. For example, you could group various statistics for outgoing mail (Figure 4). A summary also makes sense for web servers, such as a hit count, operating system distribution, and GeoIP (Figure 5). Kibana dashboards are not static; they also include a search field and additional filter options.
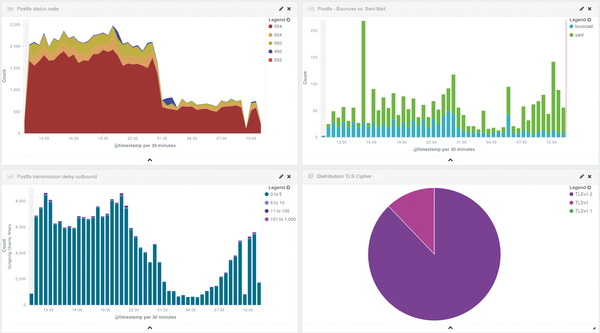 Figure 4: Kibana users can organize multiple visualizations in their own dashboards and sort them by various criteria.
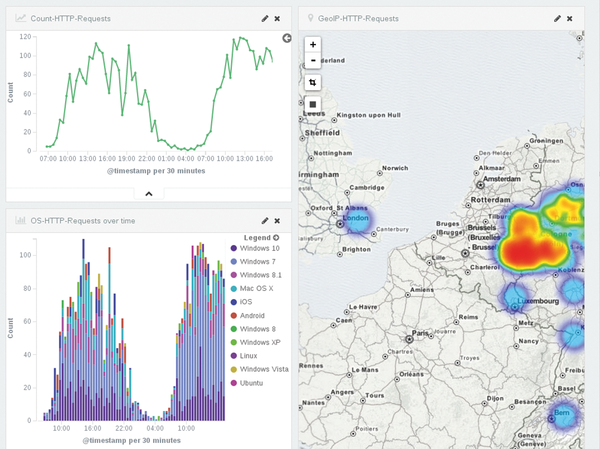 Figure 5: Kibana showing the total hits, distribution by operating system, and GeoIP on a map.
« Previous 1 2 3 4 Next »
Buy this article as PDF
(incl. VAT)
Buy Linux Magazine
US / Canada
UK / Australia
Subscribe to our Linux Newsletters
Find Linux and Open Source Jobs
Subscribe to our ADMIN Newsletters
Support Our Work
Linux Magazine content is made possible with support from readers like you. Please consider contributing when you’ve found an article to be beneficial.

News
-
So Long Neofetch and Thanks for the Info
Today is a day that every Linux user who enjoys bragging about their system(s) will mourn, as Neofetch has come to an end.
-
Ubuntu 24.04 Comes with a “Flaw"
If you're thinking you might want to upgrade from your current Ubuntu release to the latest, there's something you might want to consider before doing so.
-
Canonical Releases Ubuntu 24.04
After a brief pause because of the XZ vulnerability, Ubuntu 24.04 is now available for install.
-
Linux Servers Targeted by Akira Ransomware
A group of bad actors who have already extorted $42 million have their sights set on the Linux platform.
-
TUXEDO Computers Unveils Linux Laptop Featuring AMD Ryzen CPU
This latest release is the first laptop to include the new CPU from Ryzen and Linux preinstalled.
-
XZ Gets the All-Clear
The back door xz vulnerability has been officially reverted for Fedora 40 and versions 38 and 39 were never affected.
-
Canonical Collaborates with Qualcomm on New Venture
This new joint effort is geared toward bringing Ubuntu and Ubuntu Core to Qualcomm-powered devices.
-
Kodi 21.0 Open-Source Entertainment Hub Released
After a year of development, the award-winning Kodi cross-platform, media center software is now available with many new additions and improvements.
-
Linux Usage Increases in Two Key Areas
If market share is your thing, you'll be happy to know that Linux is on the rise in two areas that, if they keep climbing, could have serious meaning for Linux's future.
-
Vulnerability Discovered in xz Libraries
An urgent alert for Fedora 40 has been posted and users should pay attention.