
Using Go to Monitor for Available Laundromat Machines
Programming Snapshot – Go Monitoring

© Photo by Annie Spratt on Unsplash
Before doing his laundry, Mike Schilli checks the activity in the laundry room using a Go program that queries a Tapo motion detector.
Anyone who lives in an American apartment building like I do is likely to experience a thousand adventures every day. One of them takes place in the building's small laundry room, where nearly 30 occupants share two washing machines. I don't know how many times I have taken the elevator two floors down with a bulging laundry basket in tow, only to find that both machines are occupied, leading me to shout "This is a job for the German engineer in the house!" (Figure 1). In response, I built a system that now displays all the activities in the laundry room for everyone to view on the web.
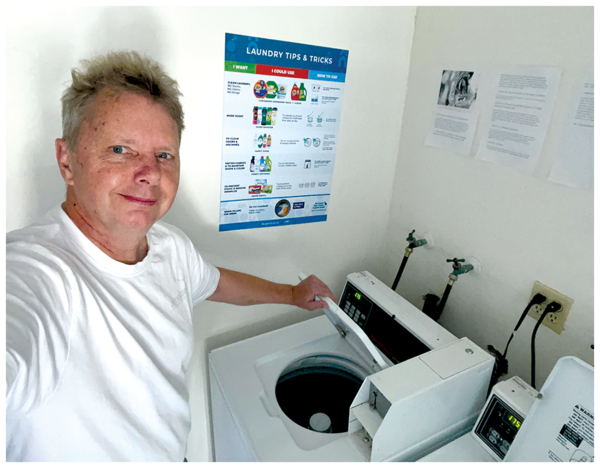 Figure 1: The author in his apartment building's laundry room.
To do this, I first glued two battery-powered Tapo T100 motion detectors to the walls of the laundry room (Figure 2); these devices are triggered by passing human bodies, as their infrared radiation changes the heat background measured by a passive infrared sensor (PIR). The sensors then send a short signal to a Tapo H100 hub, whose controller stores the timestamps of the events in an SQLite database.
[...]
Buy this article as PDF
(incl. VAT)
Buy Linux Magazine
Subscribe to our Linux Newsletters
Find Linux and Open Source Jobs
Subscribe to our ADMIN Newsletters
Support Our Work
Linux Magazine content is made possible with support from readers like you. Please consider contributing when you’ve found an article to be beneficial.

News
-
Gnome Working on Test Center App to Make Testing Easier
It's now possible to test experimental features on the Gnome desktop without worrying that you'll break things.
-
New Vulnerability Discovered in Linux Kernel
Hiding out for nearly 15 years, the Ghostlock vulnerability allows a standard logged-in user to gain root privileges.
-
New Linux Flaw Lets Attackers Escape VMs
A 16-year-old vulnerability allows an attacker to escape a virtual machine, gain access to the host, and execute malicious code.
-
Hannah Montana Linux Is Back!
Developer Noah Cagle decided the world needed the once obscure but beloved Linux distribution and gave it a decidedly pink refresh.
-
System76 Refreshes the Lemur Laptop
If you're looking for a laptop with tons of power and battery, look no further than the latest iteration of the System76 Lemur Pro.
-
More than 43 Million Lines of Code in Linux Kernel 7.2
Using the cloc utility, Michael Larabel of Phoronix discovered that Linux kernel 7.2 has over 43 million lines of code.
-
Kubuntu Focus Goes Ultra
The Kubuntu Focus team has upped the performance ante of its M2 and Zr laptops with the latest, greatest CPUs from Intel.
-
Linux Gamers May Soon See Less Mouse Lag in KDE Plasma
Gamers using KDE’s Plasma desktop have been suffering from a slight input delay in mouse movement that could lead to getting fragged.
-
Three Lines of Code Improve Linux Storage Performance
A developer changed three lines of code, giving Linux storage performance a 5% bump.
-
AUR Hit Again with Malicious Packages
Once again the Arch User Repository is plagued by a high volume of malicious packages.