
Optimizing and visualizing GPS data
Every smartphone features a GPS receiver nowadays, and a generous collection of apps are guiding hikers across hill and dale by displaying maps. Of course, things can be pretty rustic out there in the wild, and it is a good idea to use more robust, water-splash protected devices with more powerful batteries. Some time ago, I purchased a Garmin 62s – on special offer. Although it might be a little outmoded by now, it looks as if you could drive a tank over it without causing any damage.
If you are spoiled by years of intuitive on-screen operation with your smartphone, you will probably be rubbing your eyes in disbelief to discover that LCD displays with weird menu designs – in which the user has to steer the cursor with a dozen plastic buttons on the front of the device – really do still exist (Figure 1).
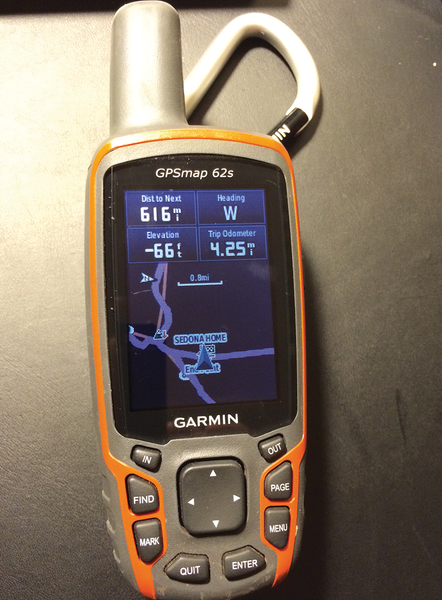 Figure 1: The Garmin GPSmap 62s.
[...]
Buy this article as PDF
(incl. VAT)
Buy Linux Magazine
Subscribe to our Linux Newsletters
Find Linux and Open Source Jobs
Subscribe to our ADMIN Newsletters
Support Our Work
Linux Magazine content is made possible with support from readers like you. Please consider contributing when you’ve found an article to be beneficial.

News
-
Kali Linux Waxes Nostalgic with BackTrack Mode
For those who've used Kali Linux since its inception, the changes with the new release are sure to put a smile on your face.
-
Gnome 50 Smooths Out NVIDIA GPU Issues
Gamers rejoice, your favorite pastime just got better with Gnome 50 and NVIDIA GPUs.
-
System76 Retools Thelio Desktop
The new Thelio Mira has landed with improved performance, repairability, and front-facing ports alongside a high-quality tempered glass facade.
-
Some Linux Distros Skirt Age Verification Laws
After California introduced an age verification law recently, open source operating system developers have had to get creative with how they deal with it.
-
UN Creates Open Source Portal
In a quest to strengthen open source collaboration, the United Nations Office of Information and Communications Technology has created a new portal.
-
Latest Linux Kernel RC Contains Changes Galore
Linux kernel 7.0-rc3 includes more changes than have been made in a single release in recent history.
-
Nitrux 6.0 Now Ready to Rock Your World
The latest iteration of the Debian-based distribution includes all kinds of newness.
-
Linux Foundation Reports that Open Source Delivers Better ROI
In a report that may surprise no one in the Linux community, the Linux Foundation found that businesses are finding a 5X return on investment with open source software.
-
Keep Android Open
Google has announced that, soon, anyone looking to develop Android apps will have to first register centrally with Google.
-
Kernel 7.0 Now in Testing
Linus Torvalds has announced the first Release Candidate (RC) for the 7.x kernel is available for those who want to test it.