
Process Tracing
Processes are, in general, units of isolation within a Unix system. This perhaps is the most important abstraction the kernel provides, because it implies that malicious or badly written programs can never affect proper ones. Isolation is the foundation of safety, but sometimes you want to turn it off.
Think of the interactive GNU Debugger (GDB) (Figure 1). You'd certainly want it to stop your code execution at specified points or execute it step-by-step, and it is hardly useful if it can't add watches or otherwise peek into the program being debugged; however, the debugger and the program it debugs are two different, isolated processes, so how could it ever happen?
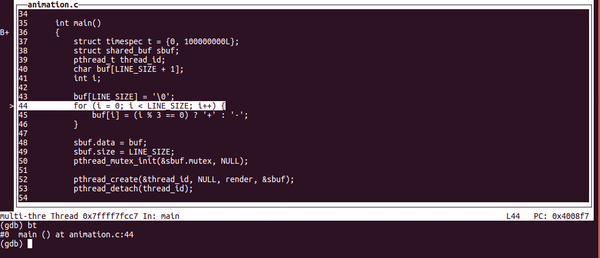 Figure 1: GDB comes with an interactive text-mode user interface, too. To enter or leave, type C-x C-a (TUI key bindings [1]).
[...]
Buy this article as PDF
(incl. VAT)
Buy Linux Magazine
Subscribe to our Linux Newsletters
Find Linux and Open Source Jobs
Subscribe to our ADMIN Newsletters
Support Our Work
Linux Magazine content is made possible with support from readers like you. Please consider contributing when you’ve found an article to be beneficial.

News
-
Alpine Linux 3.24 Features Fresh Desktops and a Newer Kernel
If you're a fan of Alpine Linux, it's time to upgrade because the latest version has been released with KDE Plasma 6.6, Gnome 50, and Linux kernel 6.18 LTS.
-
EU Open Source Strategy Plays Key Role in Tech Sovereignty Package
Comprehensive measures adopted by the European Commission aim to reduce dependency on non-EU countries.
-
Linux Foundation Report Indicates AI Driving Tech Hiring
Within growing security and skills gaps, AI has been found to be a positive driving force behind tech hiring trends in Europe.
-
United Nations Open Source Portal Goes Live
A new open source portal seeks to coordinate and scale open source efforts across the United Nations system.
-
KDE Linux Drops AUR
KDE Linux developers have dropped the Arch User Repository from the build pipeline due to security concerns; other distributions should consider doing the same.
-
California May Exempt Linux from Its Age-Verification Law
After backlash from the Linux community, California may be backing off on its promise to force all operating systems to verify age, but one platform may still have to comply.
-
Another Logic Bug Found in Linux Kernel
Qualys has discovered a vulnerability in the Linux kernel that can be used to elevate standard user privileges.
-
Ubuntu Core 26 Offers Game-Changing Enterprise Features
Ubuntu Core 26 could be a game-changer for organizations looking for increased security and reliability.
-
AI Flooding the Linux Kernel Security Mailing List
AI is giving Linus Torvalds a headache, but not in the way you might think.
-
Top Priorities for Open Source Pros Seeking a New Job
Professional fulfillment tops the list, according to LPI report.