
Traffic Watch
Analyzing Network Traffic with iftop
BySluggish network connections can be nerve-wracking. Checking live statistics about network traffic can help pinpoint the problem. Iftop is a command-line system monitoring tool that can help you identify bandwidth hogs and keep traffic moving.
Iftop (interface top) should be a part of every Linux user’s toolbox. The program shows network usage, whereas top and htop show the current CPU load. Iftop is not usually part of the standard installation, however. (See the “Installing iftop” box).
With iftop, you can find out why bandwidth is being eaten up on a network interface. The program shows the network connections between two IP addresses and how many data packets traverse the link. Alternatively, iftop shows the connection on the protocol level, for example, all FTP or HTTP traffic. Thus, iftop is especially good at troubleshooting why a line seems particularly slow.
Getting Started
Start iftop in the terminal with the iftop command. Because the program requires administrator rights, you must be root or start it with sudo.
After startup, iftop appears in three parts: at the upper edge is the data rate scale, in the middle the active network connections, and data transfer volume statistic on the bottom (Figure 1). Iftop evaluates the data from the first external network interface it detects, unless instructed otherwise (more on this later). This interface is usually eth0.
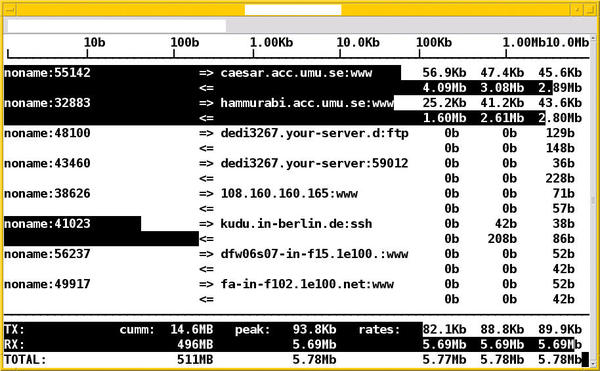 Figure 1: The iftop display shows the source without domain name but with port, and destination with domain name and protocol.
The active network connections are displayed in two lines with five columns in each. The first line is the send and the second line is the receive. A small arrow shows the direction: => is the send direction and <= is the receive direction. The columns show the source and destination of the connection along with the values for a successful data transfer. The columns on the right show the data transfer rates for the last 2, 10, and 40 seconds, respectively.
Per transmission, you’ll see a black bar that highlights the connection. The width of the bar shows the proportion of the connection to the total data transferred. In that way you can see at a glance which data stream is using the most bandwidth. With more active network connections than can fit on the screen, you can scroll through using the vim keybindings j for scrolling down and k for scrolling up.
At the bottom edge, iftop shows the transmitted TX, received RX, and TOTAL data transfers. The second column shows the cumulative values over the observed period. The three columns on the right show the cumulative progress in the previous 2, 10, and 40 seconds.
Iftop doesn’t have a lot of bells and whistles. To get an overview of options during runtime, simply press h (Figure 2). Other command help is in the comprehensive man pages; enter man iftop at the command line.
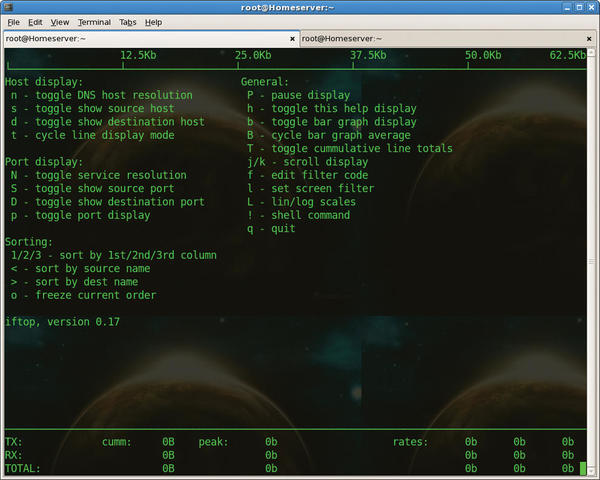 Figure 2: Pressing h brings up command help.
Customized View
You can toggle the scale for the data rate with Shift+L to linear or logarithmic mode, and iftop flashes the mode briefly in the upper left corner. Pressing b toggles the bar graph display on and off. Pressing n toggles between displaying IP addresses and resolving them into domain names via DNS.
Figure 3 shows a mixed display; some of the IP addresses can’t resolve into domain names. Also, you can see the port numbers for the connections. You can press p> to toggle the port display; Shift+S limits this action to the source ports and Shift+D to the destination ports only.
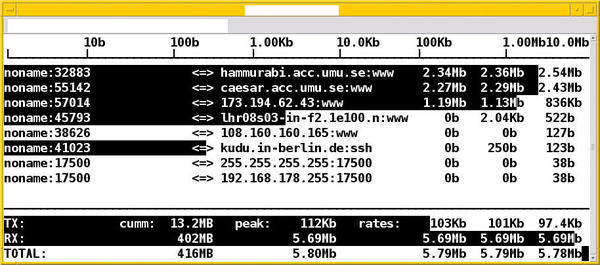 Figure 3: Compact display of the connections.
What applies to port numbers also applies to hostnames. Press s to toggle showing the source hosts and d to show the destination hosts only.
Filtering and Sorting
As you can see, iftop is quite flexible in its display characteristics. The same goes for filtering and sorting.
To view only certain network connections, set a pattern to filter the output. Press lowercase L (for limit) to open a text input box on the top line. Iftop sees this as a regular expression and shows only those connections that fit the pattern. In Figure 4, the dropbox entry sets the regular expression for finding only those connections that include the string dropbox.
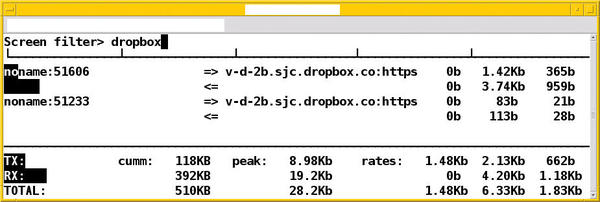 Figure 4: Filter connections using a regular expression pattern.
To sort the output, iftop provides two options. Pressing < or > sorts the output by source or destination name, respectively. 1, 2, and 3 sort by the respective time interval columns.
Call Parameters
Iftop accepts a number of parameters at startup. Many of them coincide with the aforementioned keyboard shortcuts. Curious users might be interested in the two options -i and -p. With -i (interface), you can specify which interface you want iftop to monitor. The switch -p runs iftop in promiscuous mode, which means that it also monitors traffic that doesn’t pass directly through the specified interface.
Using the -f option is a way of filtering specific packets by network, host, or port. For example, use the following to display only SSH packets that run over the /dev/wlan0 wireless interface:
# iftop -i wlan0 -f "dst port 22"
Destination port 22 is shorthand for the Secure Shell (SSH) port.
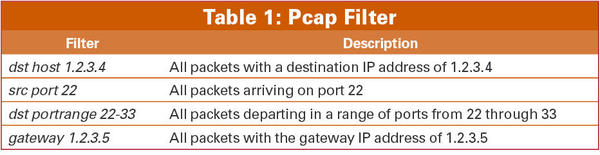
The filter expression matches the syntax for pcap-filter and allows for an elegant selection of packets. Table 1 provides some examples.
Conclusion
The iftop command-line tool captures data traffic on network interfaces and then analyzes which network connections exist and how many data packets are running on each one. In this way, you can quickly determine how much bandwidth each program and service requires and is possibly overloading. Packet filtering is just one of many options that helps.
Info
[1] Iftop: http://www.ex-parrot.com/~pdw/iftop/
[2] DEB package for Iftop: http://packages.debian.org/squeeze/iftop
[3] Finding RPMs: http://rpmfind.net
[4] Libpcap: http://www.tcpdump.org
[5] Libcurses: http://www.gnu.org/software/ncurses/ncurses.html
[6] Compiling Things on Ubuntu the Easy Way: https://help.ubuntu.com/community/CompilingEasyHowTo
Acknowledgment
The author thanks Axel Beckert for his help in preparing this article.
The Author
Frank Hofmann (http://www.efho.de/) studied computer science at the Technical University of Chemnitz, Germany. He currently works in Berlin at Buro 2.0, a network of open source experts, as a service provider specializing in printing and typesetting. Frank is also cofounder of the Wizards of FOSS training company and has coordinated meetings of the Linux User Group in the Berlin-Brandenburg region since 2008.
Subscribe to our Linux Newsletters
Find Linux and Open Source Jobs
Subscribe to our ADMIN Newsletters
Support Our Work
Linux Magazine content is made possible with support from readers like you. Please consider contributing when you’ve found an article to be beneficial.

News
-
Substantial Update to IPFire Now Available
The lastest version of IPFire features a fundamental change to how the system handles DNS.
-
Gnome Working on Test Center App to Make Testing Easier
It's now possible to test experimental features on the Gnome desktop without worrying that you'll break things.
-
New Vulnerability Discovered in Linux Kernel
Hiding out for nearly 15 years, the Ghostlock vulnerability allows a standard logged-in user to gain root privileges.
-
New Linux Flaw Lets Attackers Escape VMs
A 16-year-old vulnerability allows an attacker to escape a virtual machine, gain access to the host, and execute malicious code.
-
Hannah Montana Linux Is Back!
Developer Noah Cagle decided the world needed the once obscure but beloved Linux distribution and gave it a decidedly pink refresh.
-
System76 Refreshes the Lemur Laptop
If you're looking for a laptop with tons of power and battery, look no further than the latest iteration of the System76 Lemur Pro.
-
More than 43 Million Lines of Code in Linux Kernel 7.2
Using the cloc utility, Michael Larabel of Phoronix discovered that Linux kernel 7.2 has over 43 million lines of code.
-
Kubuntu Focus Goes Ultra
The Kubuntu Focus team has upped the performance ante of its M2 and Zr laptops with the latest, greatest CPUs from Intel.
-
Linux Gamers May Soon See Less Mouse Lag in KDE Plasma
Gamers using KDE’s Plasma desktop have been suffering from a slight input delay in mouse movement that could lead to getting fragged.
-
Three Lines of Code Improve Linux Storage Performance
A developer changed three lines of code, giving Linux storage performance a 5% bump.