Customizing the WTF dashboard tool
Programming Snapshot – Terminal Dashboard
Using extensions in Go and Ruby, Mike Schilli adapts the WTF terminal dashboard tool to meet his personal needs.
I actually wanted to write a terminal user interface (UI) for this issue that would show me important data relating to the system status and world events using widgets. But what a shock when I saw online that there is already an open source tool named WTF [1] (or wtfutil
, as it was originally called) that has been able to do all this for a long time. Written in Go, WTF can be easily extended with new widgets. Huzzah, I'll just jump on the WTF bandwagon this time!
To talk the terminal dashboard WTF into filling its tiles with various widgets, as shown in Figure 1, you first need to drop the compiled wtfutil
Go program into a bin directory as wtf
and configure a YAML file with the individual WTF modules in the various tiles. When done, call wtf
on the command line to marvel at the tiles freshly filled with content in your terminal.
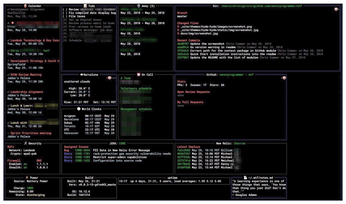
You'll find installation instructions for the tool on a wide variety of operating systems on GitHub, but ultimately all that is needed on Linux is a git clone
of the repository followed by make build
in the newly created subdirectory. Then, watch the Go compiler fetch all the dependent libraries from GitHub and bundle the whole thing into a binary in bin/wtfutil/
(Figure 2).
By the way, if you think go build
would be a good idea, you will find out that you are wrong shortly before the end of the compilation, because go build
instructs Go to store the resulting binary in a file named wtf
– but there is already a directory of that name in the repository, and alarm bells go off instead. The makefile, on the other hand, ensures that the generated binary is named wtfutil
and ends up in the bin/
directory without any collisions.
Tool Belt at the Ready
WTF already comes with a well-filled tool belt of predefined widgets that only need to be activated if required. For example, I quite liked the ipinfo
widget because my computer's official IP address frequently changes due to all kinds of VPN configurations. It is helpful to know what the Internet services I am using are thinking in terms of my geographic location.
The YAML configuration from Listing 1 drops the ipinfo
module onto the dashboard. The settings enable WTF's internally-defined ipinfo
module. For the widget to land in the top left corner of the terminal, the mods
section sets the row and column indexes to
, with a widget height and width of 1
.
The sizes and positions of tiles in WTF are determined by the global tile width and height in the grid
section, which is measured in terminal characters. A widget's position is then set by reference to the offset of a tile in the horizontal (left to right) and the vertical (top to bottom) position. For example, if you initially divided the terminal into four columns and two rows, top=0 left=0
addresses the top left tile and top=1 left=3
addresses the bottom right tile. Tiles can occupy more space than just a column or row, depending on their individual width
and height
settings, defining multiples of the base unit.
Figure 3 shows the terminal after invoking WTF with the ~/.config/wtf/config.yml
configuration file from Listing 1. Just as the doctor ordered: The upper left tile shows my current IPv4 address and the geolocation in my adopted hometown, San Francisco. A nice, useful standard widget – but now it's time to expand WTF with my creations.
Listing 1
config.yml
wtf: colors: background: black border: focusable: darkslateblue focused: orange normal: gray grid: columns: [32, 32, 32] rows: [10, 10, 10] refreshInterval: 1 mods: ipinfo: colors: name: "lightblue" value: "white" enabled: true position: top: 0 left: 0 height: 1 width: 1 refreshInterval: 150
Script One, Two, Three
Next up is a widget that measures the speed at which my Internet provider moves data in and out over my home line. Precisely measuring the available bandwidth in both directions in megabits per second (Mbps) is no trivial task, but luckily there's already a tool for that on GitHub, called p0d [2]. p0d is written in Go, and the repo can simply be cloned and compiled from source. Following the go install
command gleaned from the readme, the p0d
binary lands in the local Go path below ~/go/bin/p0d
after a while. You can convert this to an executable path for later use.
Called at the command line, p0d clutters the terminal with ASCII art and wildly incrementing counters (Figure 4). I don't want that in my widget, so the wrapper script from Listing 2, written in Ruby, calls p0d but intercepts the output and focuses only on the JSON file created (thanks to the -O
option), which contains some key data with the results from the bandwidth measurement.
Listing 2
p0d-runner
01 #!/usr/bin/ruby 02 require 'open3' 03 require 'tempfile' 04 require 'json' 05 out = Tempfile.new('p0d') 06 stdin, stdout, stderr, wait_thr = 07 Open3.popen3("p0d", "-d", "3", "-O", out.path, "https://netflix.com") 08 stdin.close 09 if wait_thr.value.exitstatus != 0 10 puts stderr.read 11 exit 12 end 13 out.rewind 14 data = JSON.parse(out.read) 15 printf("Internet Speed:\n"); 16 os = data[0]["OS"] 17 printf("Download: %d mbits/sec\n", os['InetDlSpeedMBits'].to_i); 18 printf("Upload: %d mbits/sec\n", os['InetUlSpeedMBits'].to_i);
The shortest configurable runtime for p0d seems to be three seconds; by default, it goes on for 10 seconds. This is why line 7 of Listing 2 sets a value of 3
in the third parameter to the call for Ruby's external command executor popen3()
from the Open3 package. The JSON data is output to the temporary file previously created in line 5.
After error checking, the Ruby script then rewinds the generated Tempfile
to the beginning in line 13, and the JSON parser uses parse()
to parse the data starting in line 14. The first sub-array (index
) below the OS
key contains the two Mbps values I'm looking for, representing the upload and download speeds. They are returned by p0d as floating-point numbers with a nonsensical number of decimal places in the keys InetUlSpeedMBits
and InetDlSpeedMBits
. Ruby's to_i()
string-to-integer converter rounds these values meaningfully to the nearest integer (lines 17 and 18).
The settings in Listing 3 add the wrapped tool to the WTF configuration as a widget in config.yml
. Because WTF does not inherently support p0d, the type: "cmdrunner"
directive specifies that the widget expects a command-line argument with parameters, which it then executes. The widget collects the standard output and copies it onto the tile on the dashboard. Figure 5 shows the new widget in action, below the IP widget that I described earlier. The dashboard now has two useful dials, but there is enough space for a few more, so what's next?
Listing 3
p0d Widget Definition
p0d: args: [""] cmd: "p0d-runner" colors: name: "lightblue" value: "white" enabled: true position: top: 1 left: 0 height: 1 width: 1 refreshInterval: 600 type: "cmdrunner"
DIY
Widgets on the WTF dashboard can do more than just display dynamically retrieved data line-by-line. They also offer power users the ability to select lines from the window contents and run actions on the active line.
The custom widget on the right in Figure 6 is an example of this. It retrieves a list of the latest issues of the "Programming Snapshot" column you're reading right now. It fetches them from the world-famous Perlmeister.com portal and displays their titles and publication dates. If you select one of the columns in this widget, it even launches a web browser to show you this specific issue from the Linux Magazine website. Let's look behind the scenes at this magic.
To interact with a particular widget as a WTF user, such as in the terminal UI in Figure 6, type the digit displayed next to the header (2 for the custom widget in this case). This tells the UI to focus on the selected widget. Pressing K and J subsequently moves the selection (highlighted in green) up and down within the selected widget, just like in the vi editor. Hidden away in the depths of the extension's Go code, each entry has a URL associated with it. When you press the Enter key, the widget fires up a web browser and loads the selected item from the web (Figure 7).
WTF does not support advanced features like this out of the box, but you can help it out with some Go code. To do this, you need to clone WTF's GitHub repository and modify the code. Then recompile with make build
to make new widgets available, such as the snapshot
widget created in Listings 5 through 8. The new binary then supports the snapshot
widget type, which you can include in the YAML configuration as shown in Listing 4.
Listing 4
Snapshot Configuration
snapshot: enabled: true colors: rows: even: "black" odd: "black" position: top: 0 left: 1 height: 2 width: 2 refreshInterval: 86400
Buy this article as PDF
(incl. VAT)
Buy Linux Magazine
Subscribe to our Linux Newsletters
Find Linux and Open Source Jobs
Subscribe to our ADMIN Newsletters
Support Our Work
Linux Magazine content is made possible with support from readers like you. Please consider contributing when you’ve found an article to be beneficial.
News
-
Fedora 41 Beta Available with Some Interesting Additions
If you're a Fedora fan, you'll be excited to hear the beta version of the latest release is now available for testing and includes plenty of updates.
-
AlmaLinux Unveils New Hardware Certification Process
The AlmaLinux Hardware Certification Program run by the Certification Special Interest Group (SIG) aims to ensure seamless compatibility between AlmaLinux and a wide range of hardware configurations.
-
Wind River Introduces eLxr Pro Linux Solution
eLxr Pro offers an end-to-end Linux solution backed by expert commercial support.
-
Juno Tab 3 Launches with Ubuntu 24.04
Anyone looking for a full-blown Linux tablet need look no further. Juno has released the Tab 3.
-
New KDE Slimbook Plasma Available for Preorder
Powered by an AMD Ryzen CPU, the latest KDE Slimbook laptop is powerful enough for local AI tasks.
-
Rhino Linux Announces Latest "Quick Update"
If you prefer your Linux distribution to be of the rolling type, Rhino Linux delivers a beautiful and reliable experience.
-
Plasma Desktop Will Soon Ask for Donations
The next iteration of Plasma has reached the soft feature freeze for the 6.2 version and includes a feature that could be divisive.
-
Linux Market Share Hits New High
For the first time, the Linux market share has reached a new high for desktops, and the trend looks like it will continue.
-
LibreOffice 24.8 Delivers New Features
LibreOffice is often considered the de facto standard office suite for the Linux operating system.
-
Deepin 23 Offers Wayland Support and New AI Tool
Deepin has been considered one of the most beautiful desktop operating systems for a long time and the arrival of version 23 has bolstered that reputation.