Terminal stock price display with Go
Programming Snapshot – Terminal Stock Portfolio
Instead of pulling up a browser to check his investments, Mike Schilli tracks stock prices with the help of a Go program to display graphs in the terminal.
According to US Vice President Kamala Harris, most US citizens would run out of money if faced by only $400 of unexpected costs. Since hearing this, I have made it my job to check every day whether I still have sufficient financial reserves. This includes tracking the current share price performance of some well-known companies. While there are many apps with portfolio settings that monitor a number of selected shares, I prefer to use command-line tools written in Go that run in a terminal window.
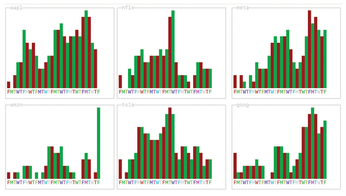
Figure 1 shows the output of the Go Pofo program (Pofo stands for portfolio). The Pofo program's output displays in six tiles (three at the bottom and three at the top), with each tile containing a bar chart to illustrate the share price performance of Apple, Netflix, Meta, Amazon, Tesla, and Google over the past six weeks. The program grabs the current and historical share price data from the data dealer Twelve Data [1] in a fraction of a second shortly after launching. Twelve Data offers a free basic plan for hobbyists that allows up to eight requests per minute and up to 800 per day before a limit kicks in.
The program fetches the closing prices in US dollars of the six monitored shares on the New York Stock Exchange for the past 45 business days. It does so in one fell swoop with a single request to the server. Figure 2 shows the data for the hyper-nervous Netflix stock in the period between June 16 and July 31, 2023. In this time frame, the value of the share fluctuated wildly between $413.17 and $477.59. Alas, in a graph of absolute values, it is still more or less impossible to see any fluctuations, because, after all, the difference only accounts for around 15 percent of the total value.
This is why the massive price jumps that typical chart apps show (Figure 3) do not reflect absolute values – otherwise you would end up with very static blocks that would not impress anybody. To counteract this, typical chart applications transform the fluctuations into relative values so that a change of a few dollars is displayed over the entire chart height.
Free After Registering
Twelve Data only provides the current price data for selected shares after you register with your email address. If you are successful, you will be given an API key (Figure 4) that must accompany each request you submit. The free trial account covers the entire US stock market; you only need a credit card for any endpoints purchased separately.
If you wanted to follow stocks on a foreign exchange, on the other hand, such as the current price of the Volkswagen share on Germany's Xetra market (symbol VOW3:XETR), there's a substantial monthly fee. Ever since Yahoo shut down its financial API more than five years ago, free access to foreign stocks has been tricky. Twelve Data, as well as all of other providers' APIs that I researched, only supports the US market with its free tier.
Listing 1 shows the Go code that retrieves the historical prices of the comma-separated ticker symbols stored in symbols
from data broker Twelve Data. The fetchQ()
function starting in line 9 returns a hashmap of results if successful. It contains an array slice of dateVal
structures under each ticker symbol (e.g., aapl for Apple). These structures each assign a date (e.g, 10-01-2023) to a share price (e.g., 123.45678).
Listing 1
quote.go
To do this, the code puts together a request to the Twelve Data website, appending the symbol
(the desired ticker symbols) and interval
(time interval, one day in the example) parameters to the base URL, and adds the API key I obtained previously. Line 22 uses Get()
to retrieve the response from the web. The parse()
function called in line 32 grabs the blob of JSON that is returned (Figure 5) and fills the Go hashmap data structure mentioned earlier.
Digging into JSON
The result is a dictionary with the stock ticker symbols as keys, with an array slice under each symbol. The array's individual elements each assign a share price to a date. I am only interested in the close
values here (i.e., the daily closing price). You could now tackle pulling the relevant parts out of the JSON blob without any trouble using a conventional approach where the developer defines appropriate Go data structures mapping the JSON in minute detail, which the JSON unmarshaler built into Go then imports from JSON into Go.
Instead, Listing 2 uses the handy gjson package from GitHub to elegantly disable Go's strict type checking before running JQuery-style queries to dig the nuggets out of the JSON. The resulting data structure, a hashmap with entries from ticker symbols, in turn points to array slices with tuples of timestamps and price values. Line 12 defines this result type and creates an instance in qMap
. As the result, the parse()
function, starting in line 14, returns a variable of this data type to the caller.
Listing 2
parse.go
The gjson package offers a Get()
function which in line 15 runs the @this
query to parse the top level of the data, which is the ticker symbols included in the web result. Map()
, also courtesy of the gjson package, immediately makes a Go map from this. The for
loop in line 18 can then iterate across all the ticker symbols. Inside the loop, the query, [symbol].values.#.datetime
, then extracts all the timestamps from the available data points. Array()
makes a Go array from this. Same goes for the closing prices, listed under close
in the JSON blob. The for
loop starting in line 23 zips the two arrays into a new array of dateVal
types – this completes the entry for each ticker symbol currently being processed.
Laying Tiles
Now the main program in Listing 3 needs to glue together the individual parts from Listing 1 and Listing 2 and set up the GUI. Like in previous Snapshots, I'm using the indestructible termui as the graphics package for the terminal; the components I need this time are the BarChart
widget and the grid
tile arranger. As you can see from Figure 1, a total of six tiles extend across the entire width and height of the terminal, sharing the space equally.
Listing 3
pofo.go
Instead of computing the X/Y coordinates of each widget, Listing 3 relies on the grid
tiler that comes courtesy of termui. The tiler's Set()
function in line 31 takes two rows, each with three BarChart
widgets, all of which are arranged side by side in the charts
array created previously. The call to the termui Render()
function in line 44 expects the grid
container widget as its only parameter and autonomously computes where to put the individual tiles.
Buy this article as PDF
(incl. VAT)
Buy Linux Magazine
Subscribe to our Linux Newsletters
Find Linux and Open Source Jobs
Subscribe to our ADMIN Newsletters
Support Our Work
Linux Magazine content is made possible with support from readers like you. Please consider contributing when you’ve found an article to be beneficial.
News
-
Wine 10 Includes Plenty to Excite Users
With its latest release, Wine has the usual crop of bug fixes and improvements, along with some exciting new features.
-
Linux Kernel 6.13 Offers Improvements for AMD/Apple Users
The latest Linux kernel is now available, and it includes plenty of improvements, especially for those who use AMD or Apple-based systems.
-
Gnome 48 Debuts New Audio Player
To date, the audio player found within the Gnome desktop has been meh at best, but with the upcoming release that all changes.
-
Plasma 6.3 Ready for Public Beta Testing
Plasma 6.3 will ship with KDE Gear 24.12.1 and KDE Frameworks 6.10, along with some new and exciting features.
-
Budgie 10.10 Scheduled for Q1 2025 with a Surprising Desktop Update
If Budgie is your desktop environment of choice, 2025 is going to be a great year for you.
-
Firefox 134 Offers Improvements for Linux Version
Fans of Linux and Firefox rejoice, as there's a new version available that includes some handy updates.
-
Serpent OS Arrives with a New Alpha Release
After months of silence, Ikey Doherty has released a new alpha for his Serpent OS.
-
HashiCorp Cofounder Unveils Ghostty, a Linux Terminal App
Ghostty is a new Linux terminal app that's fast, feature-rich, and offers a platform-native GUI while remaining cross-platform.
-
Fedora Asahi Remix 41 Available for Apple Silicon
If you have an Apple Silicon Mac and you're hoping to install Fedora, you're in luck because the latest release supports the M1 and M2 chips.
-
Systemd Fixes Bug While Facing New Challenger in GNU Shepherd
The systemd developers have fixed a really nasty bug amid the release of the new GNU Shepherd init system.