
Perl scripts analyze Jawbone UP data
To counter the widespread tendency to excessive body fat, many smartphone owners now carry little gadgets around with them, reminding them of their lack of physical activity during the day. If you sit motionless for hours in front of the screen, the idea is that such a device could motivate you to walk around the block more often, or at least use the upstairs bathroom. This trend toward self-measurement – known as quantifying yourself – has grown very popular lately.
An electronic bracelet like the UP [1] by Jawbone measures the steps you take and shows the distance traveled and calories burned in the associated smartphone app (Figure 1). The accessory is available in three sizes and several colors and costs about US$ 130. From a functional point of view, the device seems to capture only instantaneous acceleration values and accumulates them over time. The geographical position of the wearer could be determined with a GPS chip, but this added function would probably drain the device's small battery in next to no time.
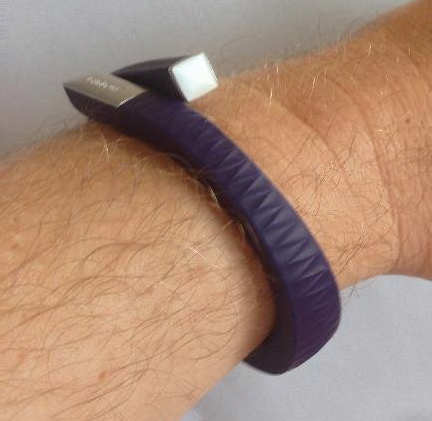 Figure 1: The Jawbone UP bracelet tallies its wearer's physical activity during the day by tracking acceleration.
[...]
Buy this article as PDF
(incl. VAT)
Buy Linux Magazine
Subscribe to our Linux Newsletters
Find Linux and Open Source Jobs
Subscribe to our ADMIN Newsletters
Support Our Work
Linux Magazine content is made possible with support from readers like you. Please consider contributing when you’ve found an article to be beneficial.

News
-
Substantial Update to IPFire Now Available
The lastest version of IPFire features a fundamental change to how the system handles DNS.
-
Gnome Working on Test Center App to Make Testing Easier
It's now possible to test experimental features on the Gnome desktop without worrying that you'll break things.
-
New Vulnerability Discovered in Linux Kernel
Hiding out for nearly 15 years, the Ghostlock vulnerability allows a standard logged-in user to gain root privileges.
-
New Linux Flaw Lets Attackers Escape VMs
A 16-year-old vulnerability allows an attacker to escape a virtual machine, gain access to the host, and execute malicious code.
-
Hannah Montana Linux Is Back!
Developer Noah Cagle decided the world needed the once obscure but beloved Linux distribution and gave it a decidedly pink refresh.
-
System76 Refreshes the Lemur Laptop
If you're looking for a laptop with tons of power and battery, look no further than the latest iteration of the System76 Lemur Pro.
-
More than 43 Million Lines of Code in Linux Kernel 7.2
Using the cloc utility, Michael Larabel of Phoronix discovered that Linux kernel 7.2 has over 43 million lines of code.
-
Kubuntu Focus Goes Ultra
The Kubuntu Focus team has upped the performance ante of its M2 and Zr laptops with the latest, greatest CPUs from Intel.
-
Linux Gamers May Soon See Less Mouse Lag in KDE Plasma
Gamers using KDE’s Plasma desktop have been suffering from a slight input delay in mouse movement that could lead to getting fragged.
-
Three Lines of Code Improve Linux Storage Performance
A developer changed three lines of code, giving Linux storage performance a 5% bump.