
Getting started with the ELK Stack monitoring solution
Today's networks require a monitoring solution with industrial-strength log management and analytics. One option that has gained popularity in recent years is ELK stack [1]. The free and open source ELK Stack collection is maintained by a company called Elastic. (According to the website, the company has recently changed the name of the project to Elastic Stack, but the previous name is still in common usage.) ELK Stack is not a single tool but a collection of tools (Figure 1). The ELK acronym highlights the importance of the collection's three most important utilities. At the heart of the stack, Elasticsearch collects and maintains data, providing an engine, based on Apache Lucene, for searching through it. Logstash serves as the log processing pipeline, collecting data from a multitude of sources, transforming it, then sending it to a chosen "stash." (Keep in mind that, despite its name, Logstash itself does not preserve any data.) Kibana provides a user-friendly interface for querying and visualizing the data.
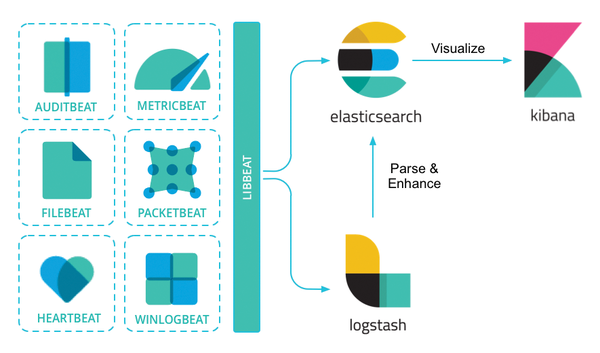 Figure 1: The ELK family and its relatives.
A bundle of tiny apps called beats specialize in collecting data and feeding it to Logstash or Elasticsearch. The beats include:
[...]
Buy this article as PDF
(incl. VAT)
Buy Linux Magazine
US / Canada
UK / Australia
Subscribe to our Linux Newsletters
Find Linux and Open Source Jobs
Subscribe to our ADMIN Newsletters
Support Our Work
Linux Magazine content is made possible with support from readers like you. Please consider contributing when you’ve found an article to be beneficial.

News
-
CachyOS Now Lets Users Choose Their Shell
Imagine getting the opportunity to select which shell you want during the installation of your favorite Linux distribution. That's now a thing.
-
Wayland 1.24 Released with Fixes and New Features
Wayland continues to move forward, while X11 slowly vanishes into the shadows, and the latest release includes plenty of improvements.
-
Bugs Found in sudo
Two critical flaws allow users to gain access to root privileges.
-
Fedora Continues 32-Bit Support
In a move that should come as a relief to some portions of the Linux community, Fedora will continue supporting 32-bit architecture.
-
Linux Kernel 6.17 Drops bcachefs
After a clash over some late fixes and disagreements between bcachefs's lead developer and Linus Torvalds, bachefs is out.
-
ONLYOFFICE v9 Embraces AI
Like nearly all office suites on the market (except LibreOffice), ONLYOFFICE has decided to go the AI route.
-
Two Local Privilege Escalation Flaws Discovered in Linux
Qualys researchers have discovered two local privilege escalation vulnerabilities that allow hackers to gain root privileges on major Linux distributions.
-
New TUXEDO InfinityBook Pro Powered by AMD Ryzen AI 300
The TUXEDO InfinityBook Pro 14 Gen10 offers serious power that is ready for your business, development, or entertainment needs.
-
LibreOffice Tested as Possible Office 365 Alternative
Another major organization has decided to test the possibility of migrating from Microsoft's Office 365 to LibreOffice.
-
Linux Mint 20 Reaches EOL
With Linux Mint 20 at its end of life, the time has arrived to upgrade to Linux Mint 22.