
Getting started with the ELK Stack monitoring solution
Today's networks require a monitoring solution with industrial-strength log management and analytics. One option that has gained popularity in recent years is ELK stack [1]. The free and open source ELK Stack collection is maintained by a company called Elastic. (According to the website, the company has recently changed the name of the project to Elastic Stack, but the previous name is still in common usage.) ELK Stack is not a single tool but a collection of tools (Figure 1). The ELK acronym highlights the importance of the collection's three most important utilities. At the heart of the stack, Elasticsearch collects and maintains data, providing an engine, based on Apache Lucene, for searching through it. Logstash serves as the log processing pipeline, collecting data from a multitude of sources, transforming it, then sending it to a chosen "stash." (Keep in mind that, despite its name, Logstash itself does not preserve any data.) Kibana provides a user-friendly interface for querying and visualizing the data.
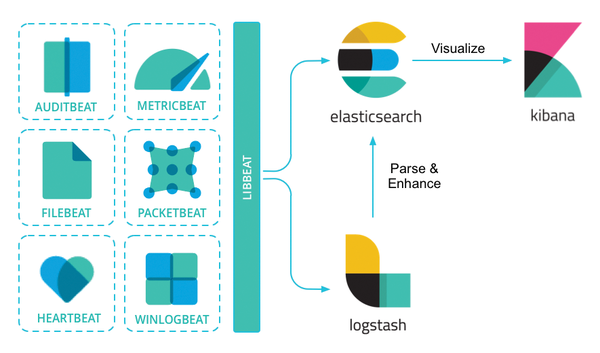 Figure 1: The ELK family and its relatives.
A bundle of tiny apps called beats specialize in collecting data and feeding it to Logstash or Elasticsearch. The beats include:
[...]
Buy this article as PDF
(incl. VAT)
Buy Linux Magazine
Subscribe to our Linux Newsletters
Find Linux and Open Source Jobs
Subscribe to our ADMIN Newsletters
Support Our Work
Linux Magazine content is made possible with support from readers like you. Please consider contributing when you’ve found an article to be beneficial.

News
-
Kali Linux Waxes Nostalgic with BackTrack Mode
For those who've used Kali Linux since its inception, the changes with the new release are sure to put a smile on your face.
-
Gnome 50 Smooths Out NVIDIA GPU Issues
Gamers rejoice, your favorite pastime just got better with Gnome 50 and NVIDIA GPUs.
-
System76 Retools Thelio Desktop
The new Thelio Mira has landed with improved performance, repairability, and front-facing ports alongside a high-quality tempered glass facade.
-
Some Linux Distros Skirt Age Verification Laws
After California introduced an age verification law recently, open source operating system developers have had to get creative with how they deal with it.
-
UN Creates Open Source Portal
In a quest to strengthen open source collaboration, the United Nations Office of Information and Communications Technology has created a new portal.
-
Latest Linux Kernel RC Contains Changes Galore
Linux kernel 7.0-rc3 includes more changes than have been made in a single release in recent history.
-
Nitrux 6.0 Now Ready to Rock Your World
The latest iteration of the Debian-based distribution includes all kinds of newness.
-
Linux Foundation Reports that Open Source Delivers Better ROI
In a report that may surprise no one in the Linux community, the Linux Foundation found that businesses are finding a 5X return on investment with open source software.
-
Keep Android Open
Google has announced that, soon, anyone looking to develop Android apps will have to first register centrally with Google.
-
Kernel 7.0 Now in Testing
Linus Torvalds has announced the first Release Candidate (RC) for the 7.x kernel is available for those who want to test it.