
Monitor your old Linux devices
Watching Grampa

© Lead Image © lightwise, 123RF.com
Create monitoring dashboards with SSH, command-line tools, and Node-RED.
Some excellent technologies and packages are available for monitoring computer hardware. For medium to large systems, the Simple Network Monitoring Protocol (SNMP) approach is usually the preferred solution. However if you have a smaller system with older or low-end servers, some excellent lightweight command-line monitoring utilities can be used instead.
These command-line utilities can be run remotely over Secure Shell (SSH) and the output parsed to return only the key data values, which can then be displayed graphically in a Node-RED web dashboard (Figure 1). In this article, I demonstrate examples that use the iostat utility [1] to monitor CPU utilization and the lm-sensors package [2] and hddtemp utility [3] to monitor temperatures on dashboards.
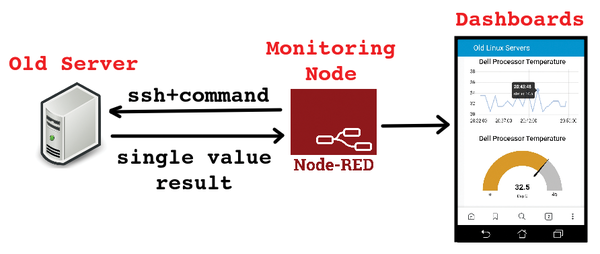 Figure 1: Sending commands over SSH to a Node-RED dashboard.
[...]
Buy this article as PDF
(incl. VAT)
Buy Linux Magazine
Subscribe to our Linux Newsletters
Find Linux and Open Source Jobs
Subscribe to our ADMIN Newsletters
Support Our Work
Linux Magazine content is made possible with support from readers like you. Please consider contributing when you’ve found an article to be beneficial.

News
-
CIQ Releases Compatibility Catalog for Rocky Linux
The company behind Rocky Linux is making an open catalog available to developers, hobbyists, and other contributors, so they can verify and publish compatibility with the CIQ lineup.
-
KDE Gets Some Resuscitation
KDE is bringing back two themes that vanished a few years ago, putting a bit more air under its wings.
-
Ubuntu 26.04 Beta Arrives with Some Surprises
Ubuntu 26.04 is almost here, but the beta version has been released, and it might surprise some people.
-
Ubuntu MATE Dev Leaving After 12 years
Martin Wimpress, the maintainer of Ubuntu MATE, is now searching for his successor. Are you the next in line?
-
Kali Linux Waxes Nostalgic with BackTrack Mode
For those who've used Kali Linux since its inception, the changes with the new release are sure to put a smile on your face.
-
Gnome 50 Smooths Out NVIDIA GPU Issues
Gamers rejoice, your favorite pastime just got better with Gnome 50 and NVIDIA GPUs.
-
System76 Retools Thelio Desktop
The new Thelio Mira has landed with improved performance, repairability, and front-facing ports alongside a high-quality tempered glass facade.
-
Some Linux Distros Skirt Age Verification Laws
After California introduced an age verification law recently, open source operating system developers have had to get creative with how they deal with it.
-
UN Creates Open Source Portal
In a quest to strengthen open source collaboration, the United Nations Office of Information and Communications Technology has created a new portal.
-
Latest Linux Kernel RC Contains Changes Galore
Linux kernel 7.0-rc3 includes more changes than have been made in a single release in recent history.