
Timechart: Zoom in on Operating System
Intel developer Arjan van de Ven is working on a new tool named Timechart that records Linux system performance in detailed graphics.
Van de Ven, who also worked on the energy-saving tool Powertop, wants to enhance tools such as Oprofile, LatencyTOP and Perf with Timechart. The new program provides graphical results, reminiscent of Bootchart, in fact going beyond the boot process analysis tool used as its model by tying in all the other processes on the system.
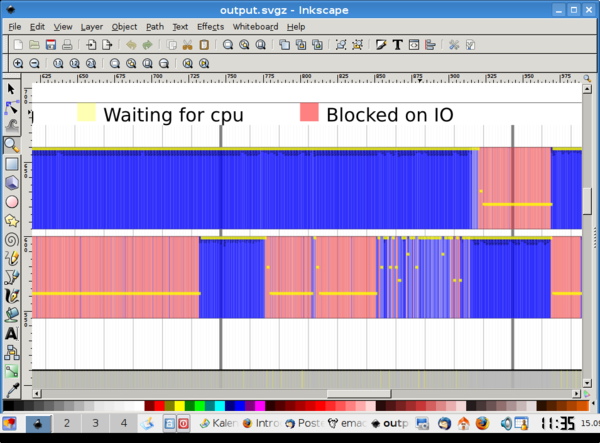 The Timechart analysis tool outputs graphics in SVG format in this release that can put programs such as Inkscape almost literally under the microscope.
Timechart renders graphics using the SVG vector format and the developer recommends using Inkscape to view the output, which in van de Ven's terms makes them "infinitely zoomable." Easily identifiable graphically are, for example, operating sytem details such as the waiting process for the scheduler -- a contribution the Intel developer can make to the current discussion about schedulers on the kernel mailing list.
Timechart also diagnoses the results of power management settings. The program supports multiprocessor machines. Further details are in van de Ven's blog entry, where he interprets some of the graphical results. The source code is currently posted as patches on the linux-kernel mailing list. A downloadable and installable version is not yet available because of changes still to be made to the kernel infrastructure to make Timechart work.
Timechart developer van de Ven still has some misgivings about the program's name and is thus looking for suggestions in his blog.
Subscribe to our Linux Newsletters
Find Linux and Open Source Jobs
Subscribe to our ADMIN Newsletters
Support Our Work
Linux Magazine content is made possible with support from readers like you. Please consider contributing when you’ve found an article to be beneficial.

News
-
New Linux Flaw Lets Attackers Escape VMs
A 16-year-old vulnerability allows an attacker to escape a virtual machine, gain access to the host, and execute malicious code.
-
Hannah Montana Linux Is Back!
Developer Noah Cagle decided the world needed the once obscure but beloved Linux distribution and gave it a decidedly pink refresh.
-
System76 Refreshes the Lemur Laptop
If you're looking for a laptop with tons of power and battery, look no further than the latest iteration of the System76 Lemur Pro.
-
More than 43 Million Lines of Code in Linux Kernel 7.2
Using the cloc utility, Michael Larabel of Phoronix discovered that Linux kernel 7.2 has over 43 million lines of code.
-
Kubuntu Focus Goes Ultra
The Kubuntu Focus team has upped the performance ante of its M2 and Zr laptops with the latest, greatest CPUs from Intel.
-
Linux Gamers May Soon See Less Mouse Lag in KDE Plasma
Gamers using KDE’s Plasma desktop have been suffering from a slight input delay in mouse movement that could lead to getting fragged.
-
Three Lines of Code Improve Linux Storage Performance
A developer changed three lines of code, giving Linux storage performance a 5% bump.
-
AUR Hit Again with Malicious Packages
Once again the Arch User Repository is plagued by a high volume of malicious packages.
-
Alpine Linux 3.24 Features Fresh Desktops and a Newer Kernel
If you're a fan of Alpine Linux, it's time to upgrade because the latest version has been released with KDE Plasma 6.6, Gnome 50, and Linux kernel 6.18 LTS.
-
EU Open Source Strategy Plays Key Role in Tech Sovereignty Package
Comprehensive measures adopted by the European Commission aim to reduce dependency on non-EU countries.