
Workshop – Accessing log data with Loki
LogQL
Loki supports complex queries through (potentially) terabytes worth of logs.
You can compose your own queries using the LogQL query language, which is a modified version of the Prometheus language (PromQL). LogQL might look complicated at first, but you'll soon discover that it is basically a glorified grep.
LogQL queries consist of two parts:
- a log stream selector
- a log pipeline
Start by selecting one or more streams, and then apply a pipeline operator specifying the string you're looking for. For example, you might want to look for all accesses coming from a specific IP address:
{job="apache"} |= "172.17.0.1"Or you might be interested in entries related to a specific page:
{job="apache"} |= "cron.php"The following query defines the exact file you wish to search, loosely looking for Firefox accesses through regexp syntax:
{job="apache",filename="/somelogsdir/access.log"} |~ "Firefox.*"You can also elect not to filter specific strings. For instance, if you wish to exclude entries with an http 200 status code from the result, use the ` character to delimit the search string:
{job="apache"} != `HTTP/1.1\" 200`LogQL also provides a way to parse specific log formats (like JSON and logfmt) using a log parser. This option won't be useful in the case of Apache logs, but you'll find great documentation on the topic in the Loki wiki [3].
Grafana and Visualization
You can display the log data in a visually meaningful form using Grafana. To speed things up, I'll deploy Grafana through the official Docker image. I will make sure to run it in host network mode so a connection to Loki is possible:
docker run -d --network host grafana/grafana
Once Grafana is up, use your browser to land on http://localhost:3000. Set up the default admin credentials, click on Configuration | Data Sources, and finally, select Add Data Source.
Select Loki as data source type and enter http://localhost:3100 as the HTTP URL parameter (Figure 1) .
 Figure 1: Connecting the Grafana instance to Loki.
The Save & Test button will make sure settings are validated. You can finally move to the Explore tab, where you can freely query any data source (Figure 2). Once the query is entered and verified, share a short link with coworkers by clicking on the Share icon in the upper part of the page (again Figure 2).
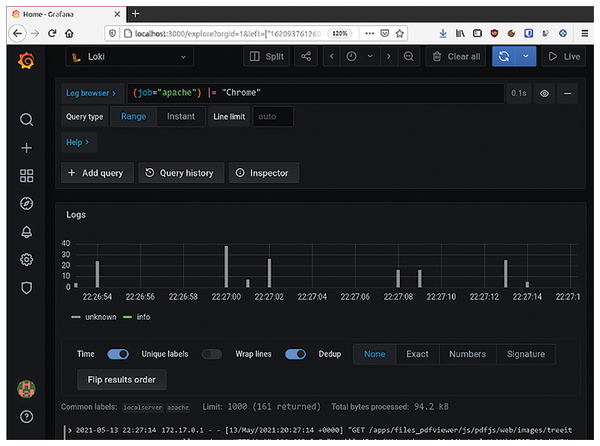 Figure 2: Comfortable querying and result sharing with Grafana.
Conclusions
Loki lets you set up a complete log aggregation infrastructure in a very short time span, without having to write a single line of code (see the box entitled "Loki vs Elasticsearch"). All components can run inside a Docker container or in a Kubernetes cluster when it's time to deploy Loki as a production application.
Loki vs Elasticsearch
In the log aggregation ecosystem, Elasticsearch (and, in general, the ELK stack) is certainly a popular choice, but in my opinion, Loki might be better for certain use cases. I give the advantage to Loki for:
- Scalability: Although Elasticsearch indexes all elements of log entries beforehand, Loki specializes in brute force text searches. Loki data is stored unstructured, meaning that Loki can handle a larger amount of data compared to Elasticsearch.
- Metrics format: Loki stores logs with the same structure logic as Prometheus TSDB (streams). This approach means that an application stack (Grafana, Prometheus, and Loki) can pinpoint an application issue starting from a metric or the other way around.
The Loki project has a comparison page for your consideration [4]. Always choose the best tool for your use case.
Loki also supports third-party storage for its logs collection (such as AWS S3 or Apache Cassandra). Next time you deploy a machine or a service, install a Promtail agent and give Loki a try. You'll be surprised by how quickly you can get productive.
Infos
- Loki: https://grafana.com/oss/loki/
- Promtail: https://grafana.com/docs/loki/latest/clients/promtail/
- LogQL Reference: https://grafana.com/docs/loki/latest/logql/
- Loki vs Elasticsearch: https://grafana.com/docs/loki/latest/overview/comparisons/
The Author

Stefano Chittaro manages multicloud deployments with a special focus on automation and observability.
« Previous 1 2
Buy this article as PDF
(incl. VAT)
Buy Linux Magazine
US / Canada
UK / Australia
Subscribe to our Linux Newsletters
Find Linux and Open Source Jobs
Subscribe to our ADMIN Newsletters
Support Our Work
Linux Magazine content is made possible with support from readers like you. Please consider contributing when you’ve found an article to be beneficial.

News
-
So Long Neofetch and Thanks for the Info
Today is a day that every Linux user who enjoys bragging about their system(s) will mourn, as Neofetch has come to an end.
-
Ubuntu 24.04 Comes with a “Flaw"
If you're thinking you might want to upgrade from your current Ubuntu release to the latest, there's something you might want to consider before doing so.
-
Canonical Releases Ubuntu 24.04
After a brief pause because of the XZ vulnerability, Ubuntu 24.04 is now available for install.
-
Linux Servers Targeted by Akira Ransomware
A group of bad actors who have already extorted $42 million have their sights set on the Linux platform.
-
TUXEDO Computers Unveils Linux Laptop Featuring AMD Ryzen CPU
This latest release is the first laptop to include the new CPU from Ryzen and Linux preinstalled.
-
XZ Gets the All-Clear
The back door xz vulnerability has been officially reverted for Fedora 40 and versions 38 and 39 were never affected.
-
Canonical Collaborates with Qualcomm on New Venture
This new joint effort is geared toward bringing Ubuntu and Ubuntu Core to Qualcomm-powered devices.
-
Kodi 21.0 Open-Source Entertainment Hub Released
After a year of development, the award-winning Kodi cross-platform, media center software is now available with many new additions and improvements.
-
Linux Usage Increases in Two Key Areas
If market share is your thing, you'll be happy to know that Linux is on the rise in two areas that, if they keep climbing, could have serious meaning for Linux's future.
-
Vulnerability Discovered in xz Libraries
An urgent alert for Fedora 40 has been posted and users should pay attention.